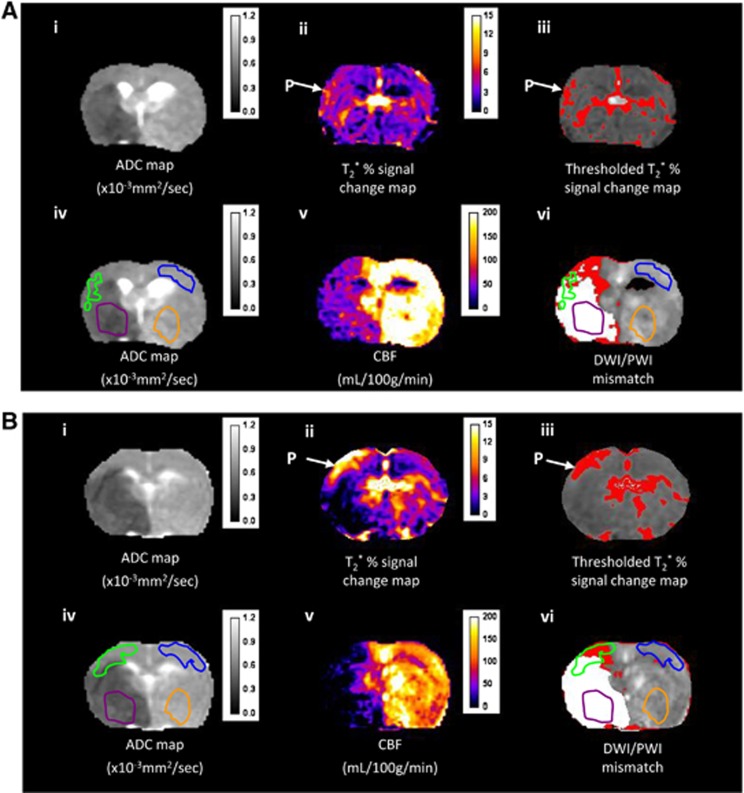
Figure 1.
Detection of the penumbra (P) using T2* oxygen challenge OC with a 0.4 fraction of inspired oxygen (FiO2) (A) or 0.4 FiO2 following 1.5 ml perfluorocarbon (PFC) intravenous (B). (i) Apparent diffusion coefficient (ADC) map prior to OC; (ii) T2* % signal change map; (iii) the corresponding thresholded image; (iv) ADC map with selected regions of interests (ROIs) superimposed (green, T2* P; blue, contralateral cortex; purple, ischemic core; and orange, equivalent contralateral ROI); (v) quantitative cerebral blood flow (CBF) map for the same slice measured at baseline prior to PFC injection and OC; and (vi) the thresholded diffusion-weighted image (DWI) lesion (white shading) and perfusion image-DWI mismatch (red shading) with the four ROIs superimposed.

