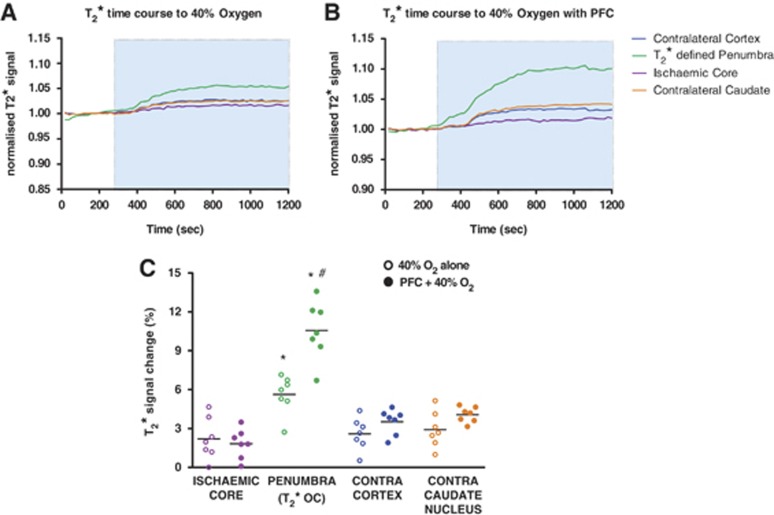
Figure 2.
Graphs showing mean time course data (n=7 per group) of T2* signal change to 0.4 fraction of inspired oxygen (FiO2) (A) or perfluorocarbon (PFC) +0.4 FiO2 (B) in the four regions of interests (ROIs); blue shading indicates the period of oxygen challenge (OC) with 0.4 FiO2. (C) Peak T2* signal changes to 0.4 FiO2 with and without prior administration of PFC in the four ROIs. Horizontal bars indicate means. *indicates significantly greater signal change in T2*-defined penumbra (P) compared to all other ROIs. #indicates significantly enhanced T2* response in the P to 40% oxygen following PFC when compared to 40% oxygen alone.

