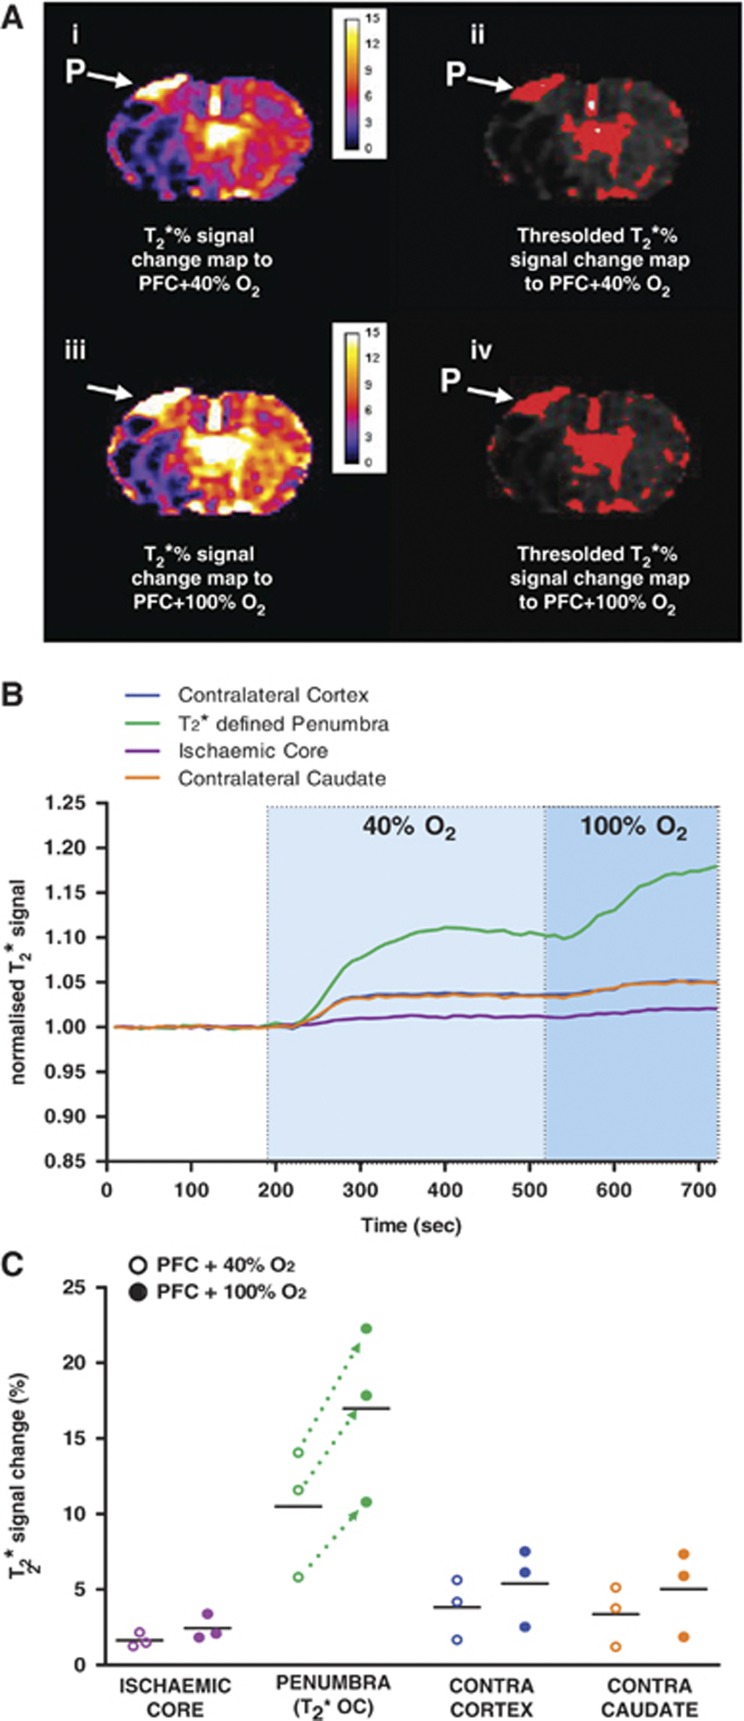
Figure 3.
(A) (i) Detection of the penumbra (P) from the T2* % signal change map using 0.4 fraction of inspired oxygen (FiO2) following 1.5 mL perfluorocarbon (PFC) intravenous; (ii) the corresponding thresholded image; (iii) detection of the P in the same animal from the T2* % signal change map following an increase in FiO2 to 1.0; (iv) the corresponding thresholded image. (B) Graph showing mean (n=3) time course of T2* signal change in regions of interests (ROIs) to 0.4 FiO2 (light blue shaded area) and 1.0 FiO2 (darker blue shaded area) following administration of PFC. (C) Peak T2* signal change in ROIs to 0.4 and 1.0 FiO2 following administration of PFC. Dotted lines indicate further increase in T2* within the P ROI on increasing FiO2 from 0.4 to 1.0 following PFC. Horizontal bars indicate means.

