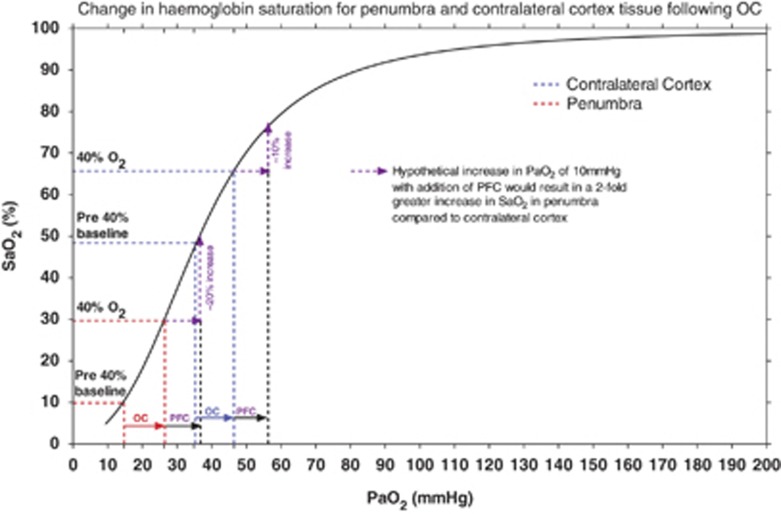
Figure 4.
Standard hemoglobin dissociation curve (black line) for Sprague-Dawley rats (modified from Cartheuser 38) where arterial hemoglobin saturation (SaO2%) is plotted against partial pressure of oxygen in arterial blood (PaO2). Brain tissue pO2 data have been superimposed from one of our earlier studies (brain tissue pO2 was measured simultaneously in the presumed penumbra (P) and corresponding contralateral cortex using implanted Oxyflo/Oxylite probes19) to emphasize the expected SaO2 changes associated with 40% O2 oxygen challenge (OC) and perfluorocarbon (PFC)+40% O2 in the contralateral cortex and P.

