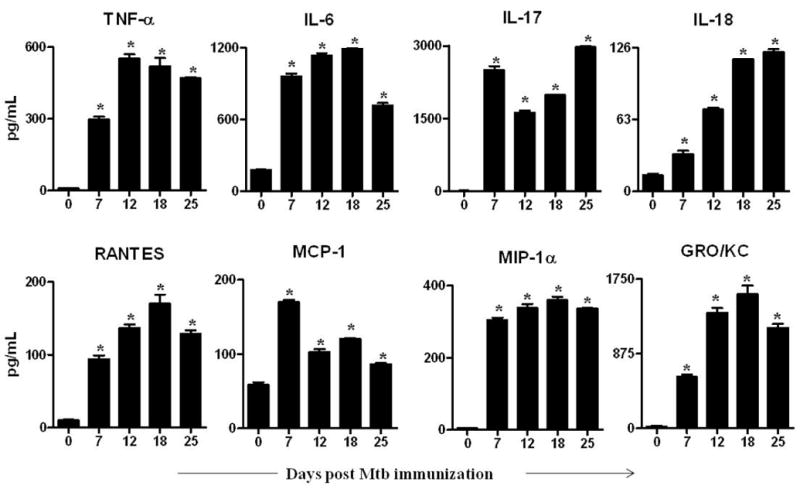
Figure 2. Cytokine/chemokine profiles through the disease course in arthritic rats.

Lymph node cells (LNC) were harvested at each phase of the disease from Mtb-immunized and naïve rats (n= 3 per group) as described under Methods. Thereafter, these cells were restimulated for 24 h with Mtb sonicate (10 μg/mL). The levels of the indicated cytokines (Top panel) and chemokines (Bottom panel) were measured in culture supernatants of LNC using a Multiplex assay and the results were expressed as pg/mL. *, p<0.05, comparing the level at each phase of arthritic rats with that of naïve rats.
