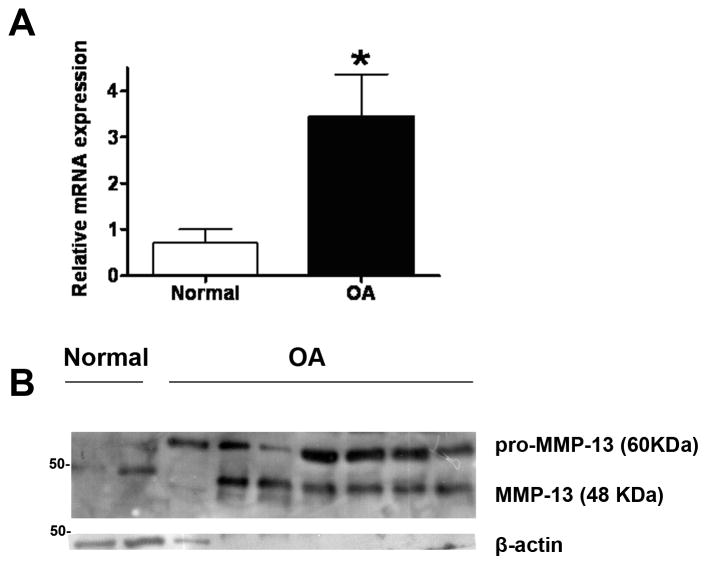
Figure 1. MMP-13 is dramatically elevated in OA chondrocytes.
A) Indicative Real Time PCR result for MMP-13 mRNA expression using cDNA isolated from normal and OA chondrocytes. For normal chondrocytes n=7, and for OA chondrocytes n=18. Asterisk indicates a statistically significant difference (p <0.05). B) Indicative western blot showing MMP-13 protein expression in normal and OA primary chondrocytes. β-actin is used as loading control.

