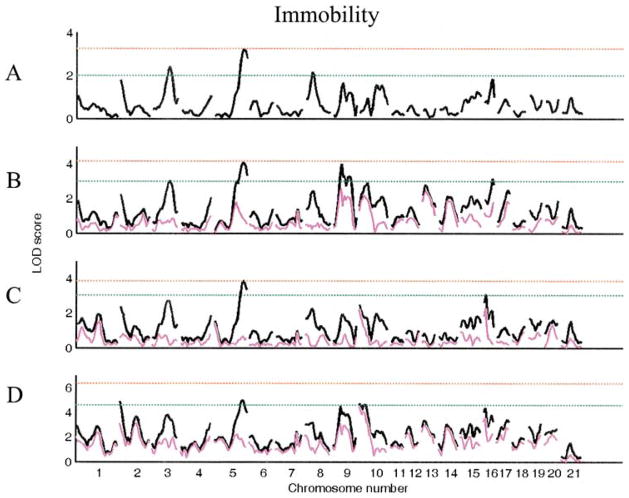
Figure 2.
LOD plots of genome scans for log (immobility). Chromosome location is on the X axis, LOD score is on the Y axis. The red line indicates significant and the green line indicates the suggestive threshold. (A). Scan for main effects with sex and lineage as additive covariates. (B). Scan with sex as interactive and lineage as additive covariate. (C). Scan for main effects with lineage as interactive and sex as additive covariate. (D). Scan for main effects with sex and lineage as interactive covariates. Pink trace in scans B–D represents the covariate (sex or lineage) by QTL alone.

