
Figure 6.
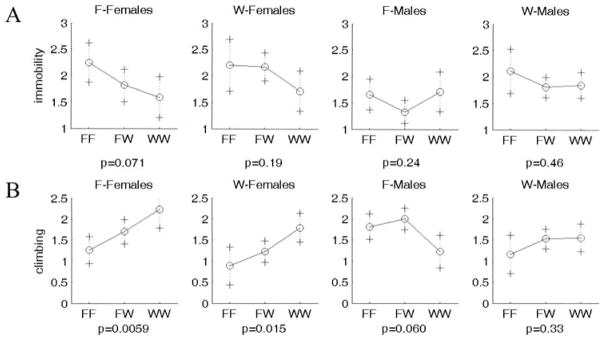
Representative plot of allele effects showing transgressive segregation (WKY homozygotes show F344 profile with decreased immobility and increased climbing). Chr 16 at 25 cM shows paradoxical F344 profile for (A) immobility and (B) climbing. One plot is shown for each group separated by sex and lineage. F-Females and F-Males represent F2 generation rats from a F344 grandmother x WKY grandfather lineage, whereas W-Females and W-Males represent F2 generation rats from a WKY grandmother x F344 grandfather lineage. X axis represents genotypes. F and W represent F344 and WKY alleles, respectively. FW represents heterozygote for each allele. Y axis is log(immobility) and log(climbing), respectively.