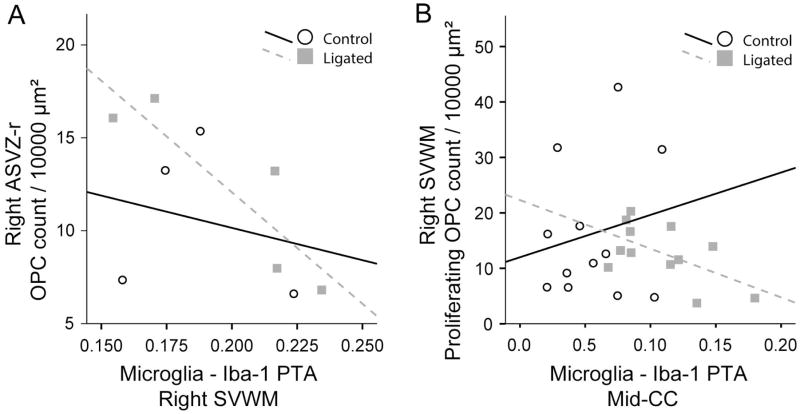
Figure 6. Correlation between microglial activation and OPC counts and proliferation.
Pearson’s correlations were performed to look for associations between Iba1 PTA values and total OPC or proliferating OPC counts at 24h and 48h after ligation. At 24h after ligation, there was a significant negative correlation between ASVZ-r OPC counts and the adjacent SVWM Iba1 on the ligated side (r= −0.88, p < 0.05, n= 5, A). Such correlation was not significant in control animals (n= 4). At 24h and 48h after ligation, there was a significant negative correlation between SVWM proliferating OPC counts (ligated side) and Mid-CC Iba1 in ligated animals (r= −0.58, p < 0.05, n=12) but not in controls (n=12).

