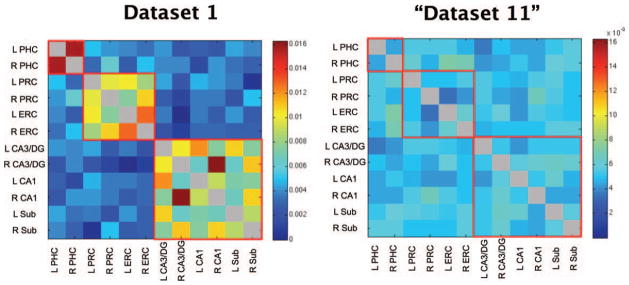
FIGURE 2.

(Left) Z-transformed correlation coefficients averaged across all participants in Dataset 1 for all possible pairs of ROIs. The diagonal is grayed out since seed regions are perfectly correlated with themselves. Regions of high functional connectivity are outlined in red for visualization. Notably, there is relatively weak functional connectivity between the MTL cortices and the hippocampal subfields. (Right) A dataset of 20 fake participants created by scrambling the average correlations coefficients of dataset 1 twenty times. The scrambled “Dataset 11” does not show the same patterns of functional connectivity as dataset 1 or the other datasets (see Fig. 3). L, left; R, right; PHC, parahippocampal cortex; PRC,. perirhinal cortex; ERC, entorhinal cortex; DG, dentate gryus; Sub, subiculum.
