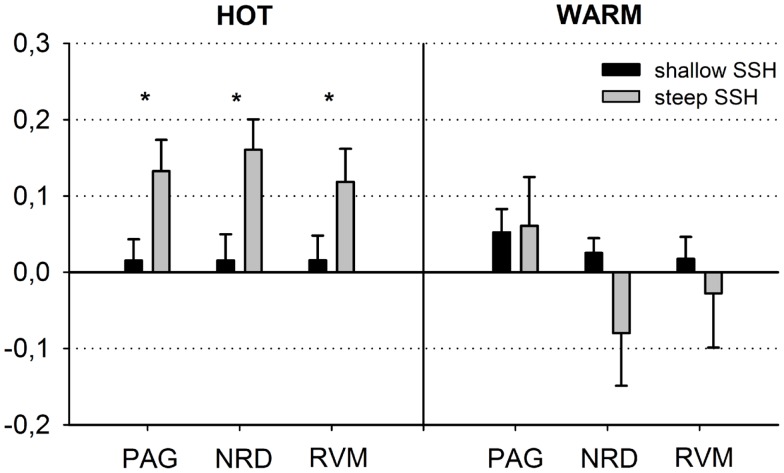
Figure 3.
Schematic overview of the blood oxygen level dependent (BOLD) responses in the periaqueductal gray (PAG), the nucleus Raphe dorsalis (NRD), and the rostral ventromedial medulla (RVM) (steep vs. shallow SSH for Thot and Twarm conditions). The figure depicts means ± SE of parameter estimates for the peak voxel of the structures.

