
FIG 2.
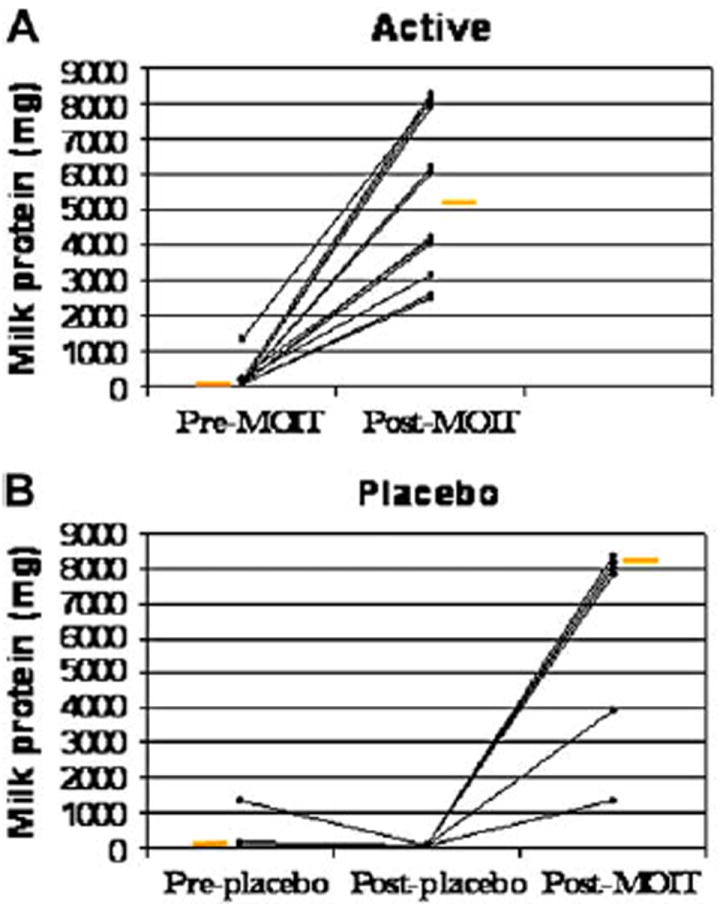
Change in milk dose threshold. A, Threshold change in active group (P = .002). B, Threshold change in placebo group (P = .16). Change in threshold after open-label active treatment in the placebo group is also shown in Fig 2, B (from after placebo to after milk OIT). Change in threshold for active versus placebo groups, P = .0003. Orange bars represent medians. MOIT, Milk OIT.