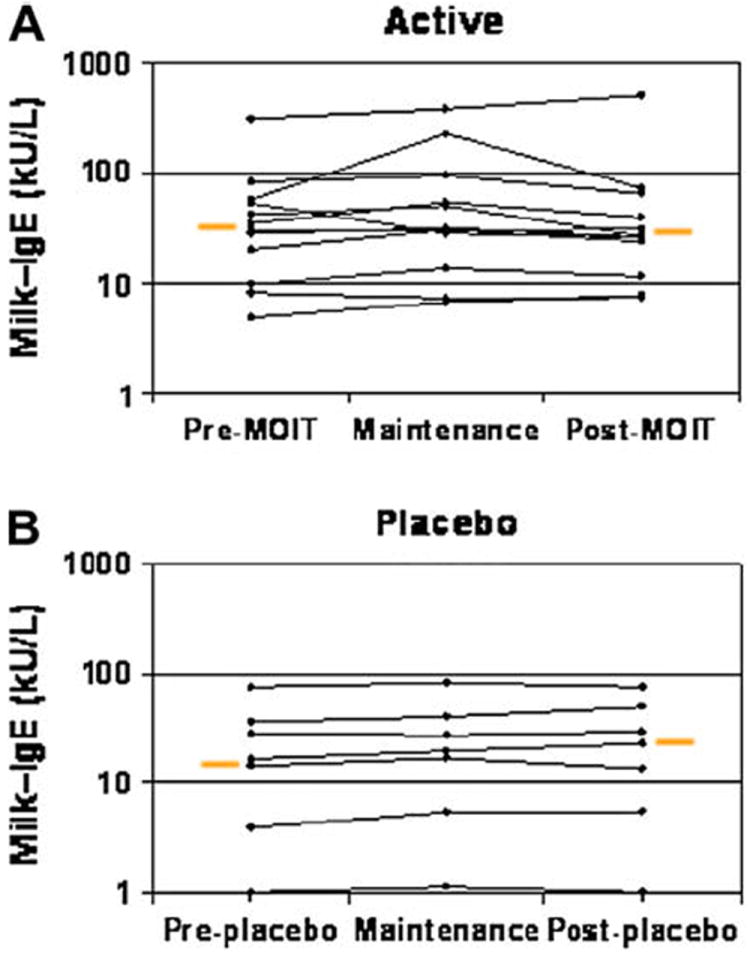
FIG 4.

Change in milk-specific IgE levels. Results are shown before milk OIT (MOIT), at maintenance, and after MOIT for the active group (P = .75; A) and placebo group (P = .46; B). Change in threshold for active versus placebo groups, P = .87. Orange bars represent medians.
