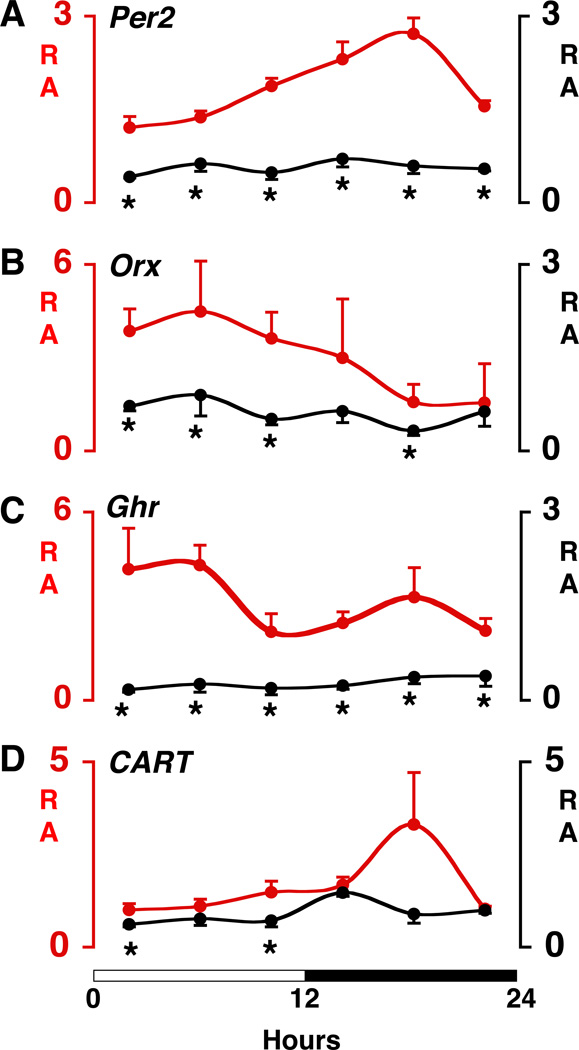
Fig. 3.
Altered diurnal rhythms and abundance in Clock mutant mice of Per2 mRNA and mRNAs encoding selected hypothalamic peptides involved in energy balance. (A–D) mRNA relative abundance (RA) curves. Time-course variation of transcripts in the hypothalamus of WT (red line) and Clock mutant (black line) mice across a 12:12 LD cycle (indicated by white-black bar on bottom). Real-time PCR was used to determine transcript levels. Values are displayed as RA (mean ± SEM) after normalization to glyseraldehyde-3-phosphate dehydrogenase (GAPDH) expression levels in the same sample. Note that for visual clarity the RA scales vary for the different transcripts and vary between genotypes for orexin and ghrelin. Brains were collected at 4-hour intervals across the 12:12 LD cycle using four WT and four Clock mutant mice at each time point. Genotype comparisons were made at each 4-hour time point using independent sample t-tests with a significance level of p<.05 (*). Per2 = Period-2; Orx = Orexin; Ghr = Ghrelin; CART = Cocaine- and amphetamine-regulated transcript.

