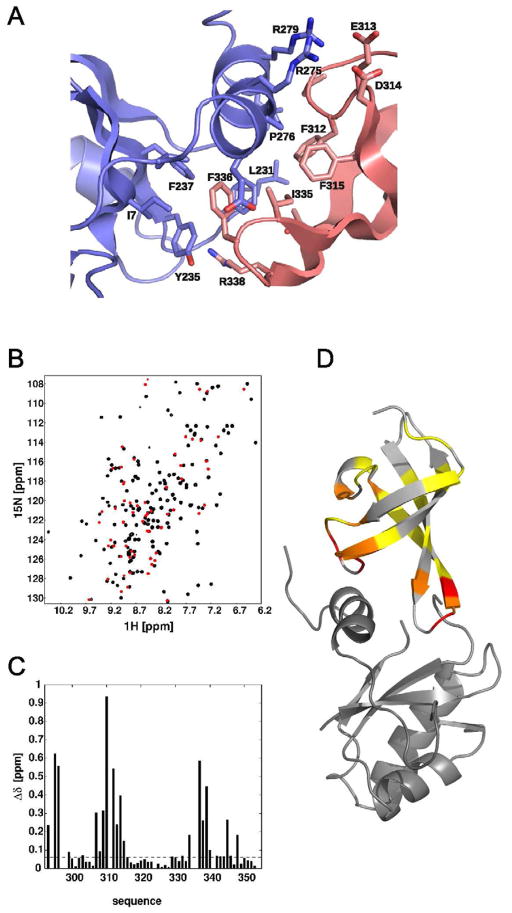
Figure 2.
Domain interaction of TmNusG. A) Expanded view of the domain interface between NTD (blue) and CTD (light red). Side chains with buried surfaces compared to isolated domains are shown in stick representation. B) Superposition of 1H, 15N HSQC spectra of TmNusGNTD-CTD (black) and TmNusGCTD (red). C) Normalized chemical shift differences of backbone amide resonances between TmNusGNTD-CTD and TmNusGCTD as a function of sequence. D) Mapping of chemical shift differences onto the crystal structure of TmNusG. The inserted domain II is omitted for clarity. Color coding from yellow to red indicates increasing chemical shift differences.

