
Figure 5.
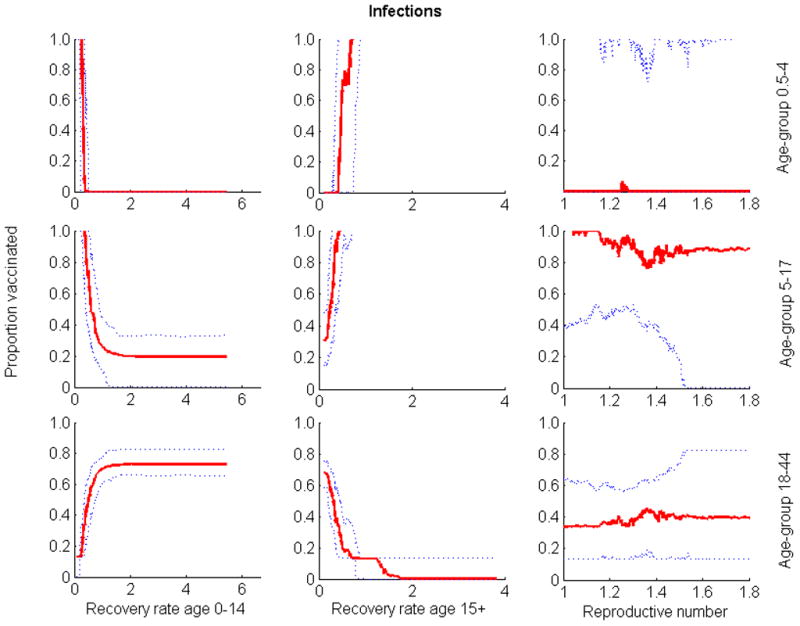
Relationship between the three parameters whose uncertainty exhibited the greatest impact on outcome and the optimal proportion of vaccine allocated to the different groups when quantifying outcome by number of infections. Optimization was performed for 80 million of vaccine doses. Solid lines are medians; dotted lines are 25th and 75th percentiles.