
Figure 8.
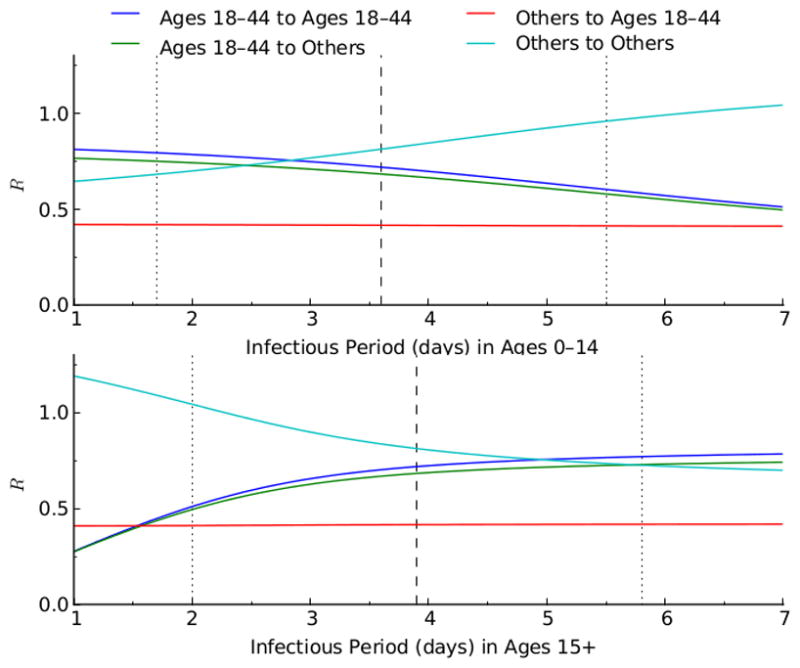
Relationship between the reproductive numbers (R), of the age group 18–44 and the other age groups, and the infectious period (1/recovery rate). The blue and green lines show respectively the within- and between-group reproductive number of age group 18–44. The light blue and red lines represent respectively the within- and between-group reproductive number of the other age groups.