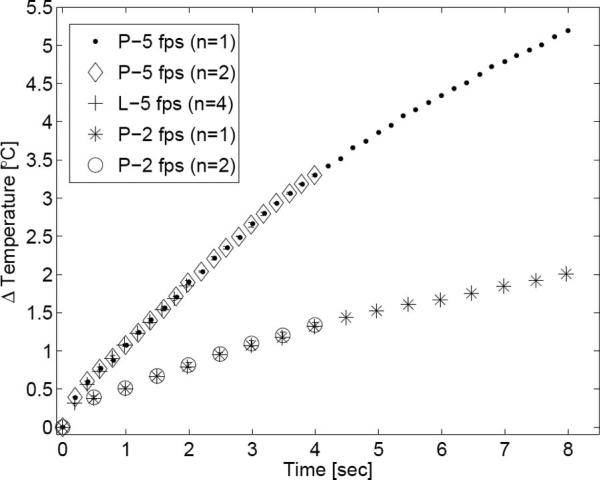
Fig. 10.
Transducer surface heating plot. The maximum transducer face temperature increase following each frame acquisition is plotted for the MMP acquisition scheme. The key indicates the test medium (P = phantom; L = bovine liver), frame rate, and number of samples averaged for that trial. When possible, error bars indicating one standard deviation are also shown.

