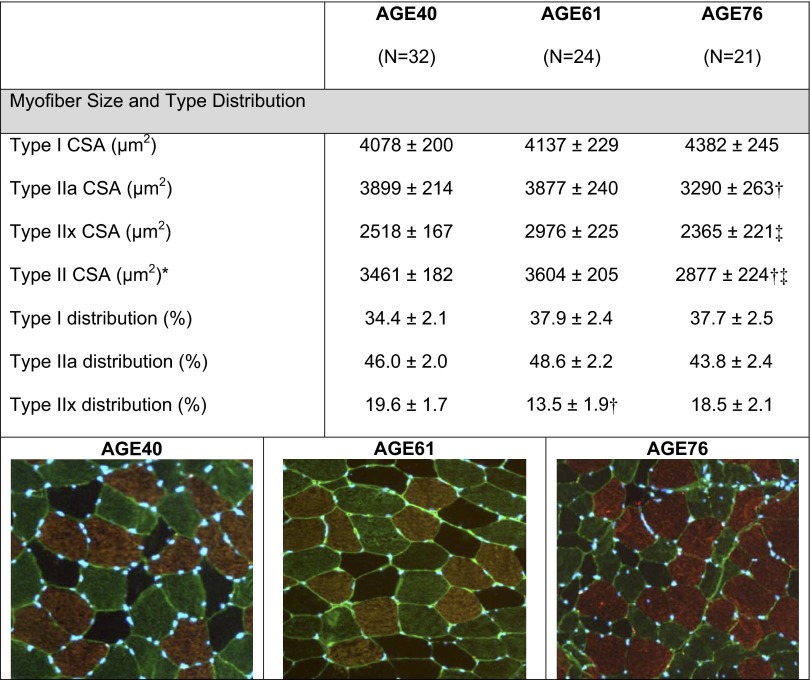
Fig. 1.
Myofiber size and type distribution of each age group [40 (AGE40), 61 (AGE61), and 76 yr of age (AGE76)]. CSA, cross-sectional area (μm2). Representative immunohistochemical images: type I = copper; type IIa = green; type IIx = black (negative). Values are least squares (adjusted) means ± SE. *Main age effect, P < 0.05. †Smaller than AGE40, P < 0.005. ‡Smaller than AGE61, P < 0.05.

