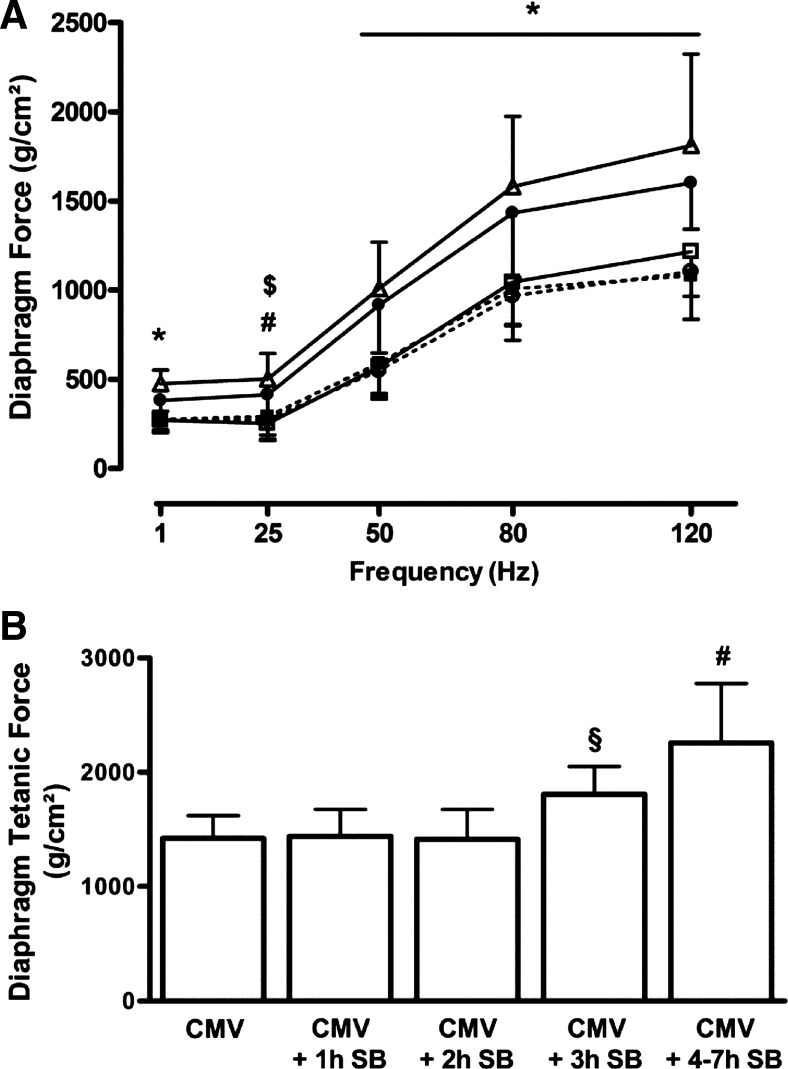
Fig. 1.
A: force-frequency relationship in the diaphragm of controlled mechanical ventilation (CMV) rats (CMV, □, n = 16), and CMV followed by 1, 2, 3, or 4–7 h of spontaneous breathing (SB): CMV + 1 h SB (■ and dashed line, n = 9), CMV + 2 h SB (○ and dashed line, n = 9), CMV + 3 h SB (●, n = 9), CMV + 4–7 h SB (△, n = 9). B: diaphragm maximal tetanic force of the same experimental groups. Maximal tetanic force was measured at 160 Hz at the beginning of the protocol. Values are means ± SD. *P < 0.05, CMV + 3 h SB and CMV + 4–7 h SB vs. others. #P < 0.01, CMV + 4–7 h SB vs. CMV, CMV + 1 h SB and CMV + 2 h SB. $P < 0.01, CMV + 3 h SB vs. CMV. §P < 0.05, CMV + 3 h SB vs. CMV and CMV + 4–7 h SB.

