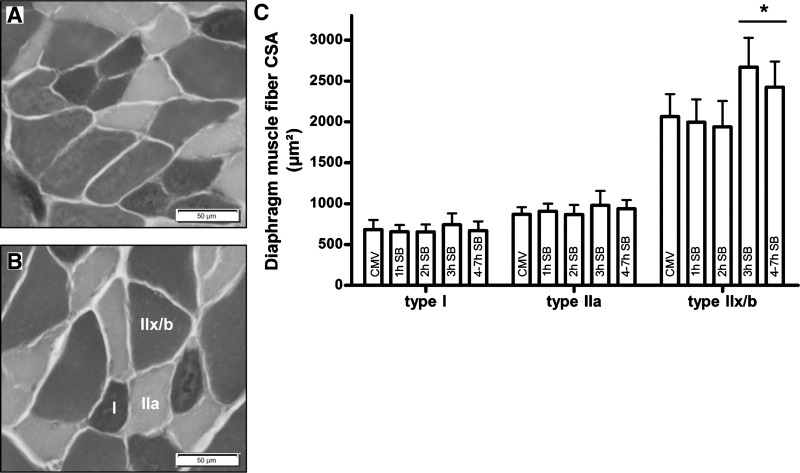
Fig. 2.
Representative photographs of a histochemical ATPase staining of the diaphragm muscle fibers in the CMV group (A) and the CMV + 3 h SB group (B) are shown on the left. Photographs are taken at magnification ×20, and type I, type IIa, and type IIx/b fibers are indicated in B. C: diaphragm cross-sectional area (CSA) of type I, IIa, and IIx/b muscle fibers in the CMV animals (CMV, n = 8) and CMV + 1 h SB (1 h SB, n = 8), CMV + 2 h SB (2 h SB, n = 9), CMV + 3 h SB (3 h SB, n = 7), and CMV + 4–7 h SB (4–7 h SB, n = 9). Values are means ± SD. *P < 0.05, CMV + 3 h SB and CMV + 4–7 h SB vs. others.

