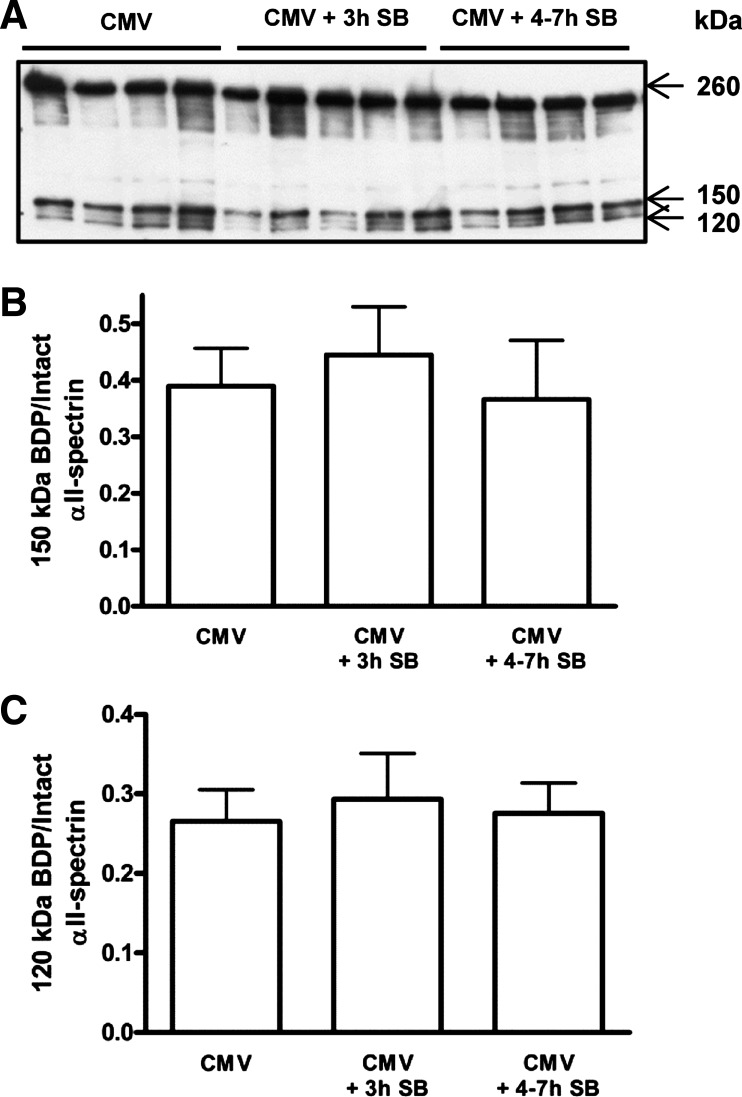
Fig. 4.
A: representative immunoblot for the analysis of intact and cleaved αII-spectrin in the diaphragm of CMV (n = 8) and CMV + 3 h SB (n = 9) and CMV + 4–7 h SB (n = 8). B: mean densitometric values for αII-spectrin degradation by calpain. Values are shown as the ratio of the 150-kDa breakdown product (BDP) to intact αII-spectrin (260 kDa). C: mean densitometric values for αII-spectrin degradation by caspase-3. Values are shown as the ratio of the 120-kDa BDP to intact αII-spectrin. Values are means ± SD.

