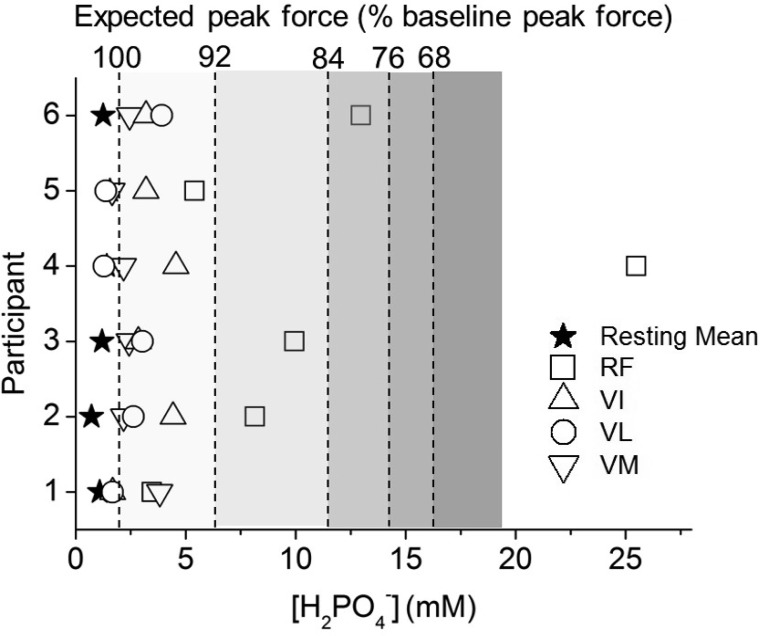
Fig. 8.
Calculated concentration of diprotonated (monanionic) Pi (H2PO4−) (63) plotted for each participant at rest and at the limit of tolerance of incremental exercise in the 4 knee-extensor muscles: RF, VI, VL, VM. Symbols are as defined in Fig. 5 legend. The resting value (★) is the mean of all 4 knee extensors. Shaded panels show expected peak force as a percentage of the baseline muscle value, calculated as a function of H2PO4− concentration on the basis of the relationship observed in a study of human first dorsal interosseous muscle (8).

