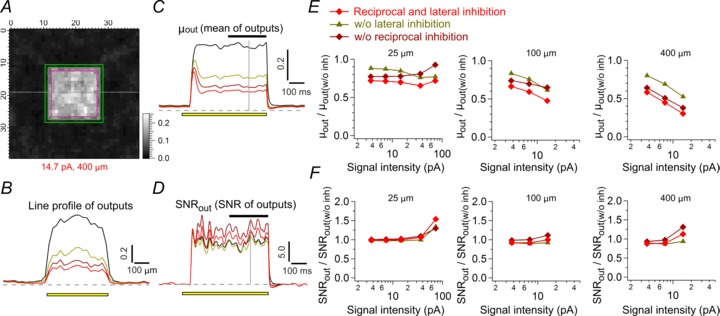
Figure 8. Simulated Mb1 bipolar cell outputs in response to various inputs.

A–D, model output (A) in response to a square input (14.7 pA, 400 × 400 μm) at the time indicated by the grey vertical line in C and D. The output profile of the horizontal grey line in A (B), mean of the outputs in the inner edge region (magenta in A) (μout; C), and SNR of the outputs (SNRout; D) to the square input are shown for each model: the model with both inhibition (red), that without reciprocal inhibition (dark red), that without lateral inhibition (yellow), and that without any inhibition (black). SNR of the outputs was calculated as (μi−μo)/σo, where μi and μo is mean of the outputs in the inner edge region (magenta in A) and the outer edge region (green in A), respectively, and σo is standard deviation of the outputs in the outer edge region. The yellow bar indicates the position (B) or the period (C and D) of the applied square input. The horizontal black bar in C and D (last 250 ms of the square input) indicates the period, in which mean and SNR of the outputs are calculated in E and F. E and F, mean of the outputs in the inner edge region (E) and SNR of the outputs (F) as a function of the intensity and side length of the applied square input (averaged values for 250 ms period shown as the black bar in C and D). Values were normalized to that in the model w/o inh (black traces in B–D). The colour and symbols for each model correspond to those in B–D. SNR, signal-to-noise ratio; w/o inh, without any inhibition.
