
Figure 4. Frequency dependence of adenosine release.
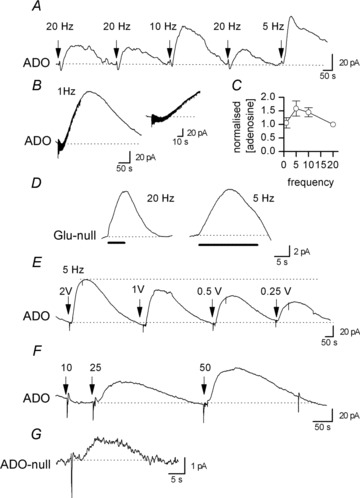
A, biosensor recording of increases in extracellular adenosine concentration evoked with different stimulation frequencies, with the number of stimuli kept constant (100). Changing the stimulation frequency from 20 to 10 Hz and then from 20 to 5 Hz increased the concentration of adenosine detected. B, biosensor recording of the increase in adenosine concentration produced by 1 Hz stimulation (100 stimuli). Inset, an expanded portion of the trace from B showing that the rise in extracellular adenosine concentration occurs after ∼30 stimuli. C, graph summarising the effect that changing the stimulation frequency has on the concentration of adenosine detected following stimulation. The adenosine concentration is normalised to the concentration detected at 20 Hz and summarises data from six slices. D, glutamate biosensor recordings illustrating the increase in extracellular glutamate concentration produced by 20 and 5 Hz trains of stimuli. The filled line indicates the stimulation period. The records have had the null sensor responses subtracted to leave the glutamate concentration transient. E, example of an adenosine biosensor trace, illustrating how the concentration of adenosine detected scales with the stimulation voltage (5 Hz, 100 stimuli). F, example of a biosensor trace showing how the concentration of adenosine detected scales with the number of action potentials (stimuli). No increase in extracellular adenosine concentration, above baseline, could be detected with only 10 stimuli, but with 25 and 50 stimuli, increasing concentrations of adenosine could be detected. The stimulation frequency was 5 Hz. G, example of a biosensor trace (ADO-null) illustrating an increase in adenosine concentration produced by a single stimulus.