
Figure 8. Effects of the gliotoxin flouroacetate (FAC) on adenosine release.
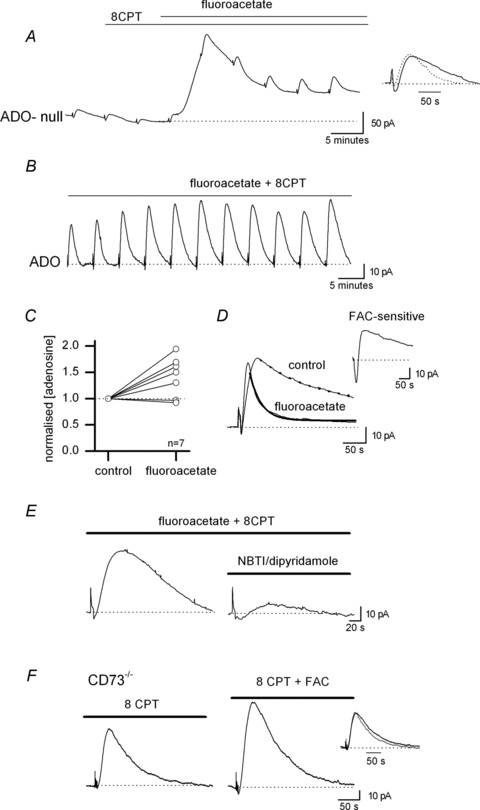
A, example biosensor trace showing the effects of FAC (5 mm). Application of FAC caused an increase in the extracellular concentration of adenosine and enhanced the stimulated increase in adenosine concentration. Inset, normalised and superimposed adenosine waveforms (from A) in control and in FAC (dotted line) to illustrate the speeding of rise and decay kinetics in FAC. B, example biosensor trace illustrating how prolonged application of FAC (5 mm) had little effect on the stimulated increases in adenosine concentration detected by the biosensor. In this example, FAC had been applied for ∼70 min. C, graph illustrating the effects of FAC on the concentration of adenosine detected following stimulation (n= 7 slices). The adenosine concentration is normalised to control values. D, superimposed biosensor traces in control and in FAC to illustrate an example recording where there was very marked changes in waveform kinetics. The decay of the waveforms has been fitted with a single exponential (control τ = 128 s, FAC τ = 28 s). Inset, the waveform in FAC subtracted from the waveform in control to illustrate the FAC-sensitive component of adenosine release. E, example biosensor traces in FAC (5 mm). Addition of 5 μm NBTI and 10 μm dipyridamole (to block ENTs) markedly (∼80%) reduced the concentration of adenosine detected. F, example biosensor traces of adenosine release in control and in FAC (5 mm) taken from a CD73−/− slice. Although FAC increased the concentration of adenosine detected there was little change in the time course of the adenosine biosensor waveform (as illustrated in the inset, grey line is control).