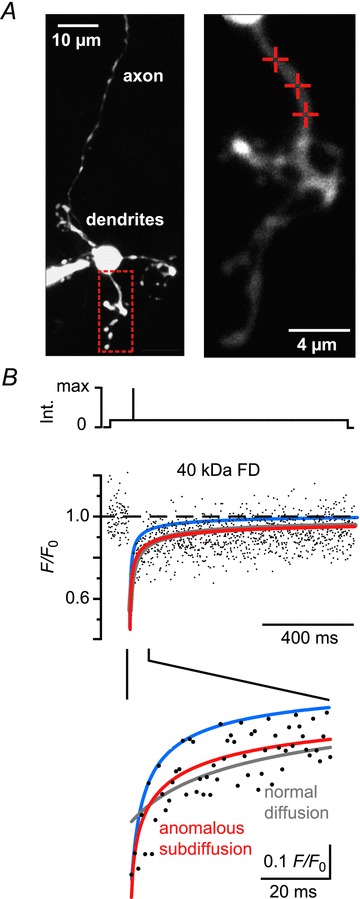
Figure 1. Anomalous subdiffusion in granule cell dendrites.

A, left: contrast-enhanced two-photon image (z-stack) of a granule cell filled with a 40 kDa FD (500 μm) via a somatic patch pipette. The red box outlines the dendritic region shown magnified on the right. Cross-hairs denote the positions on which fluorescence recovery after photobleaching recordings (shown in B) were performed. B, top: scheme of the laser intensity protocol. Middle: dendritic fluorescence recovery after photobleaching time course. The dots represent the average of three normalized recordings (F/F0) from the spots denoted in A. The lines represent fits to the fluorescence recovery assuming free diffusion (grey line, eqn 1 in Methods) or anomalous subdiffusion (red line, eqn 2). The blue line shows the calculated recovery for free diffusion using the previously published diffusion coefficient of 40 kDa FD (Schmidt et al. 2007a). The lower panel shows the initial recovery expanded in time. Note that the subdiffusion model yields the best fit to the recovery. FD, fluorescein dextrans; Int., laser intensity.
