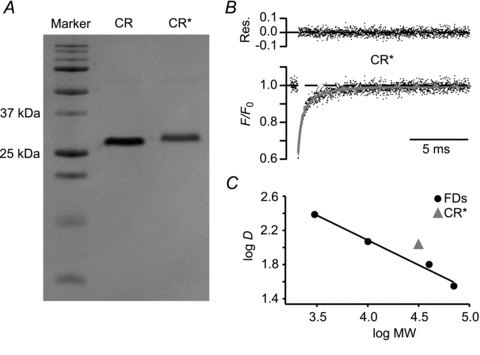
Figure 3. CR* diffusion in vitro.

A, SDS-gel of native and CR* (CR and CR*, respectively). MW markers are shown in the left lane: 10, 15, 20, 25, 37, 50, 75, 100, 150 and 250 kDa from bottom to top. B, aqueous fluorescence recovery after photobleaching time course of CR* dissolved in pipette solution in a cuvette (average of 2500 individual recordings) and a fit to a three-dimensional, normal diffusion equation (grey line; top: residuals). C, logarithms of the mean aqueous D values of CR*, 3 kDa, 10 kDa, 40 kDa and 70 kDa FD plotted against the logarithms of their MW. Four experiments each. s.e.m. values are smaller than the markers. Linear regression to the dextran data yielded a slope of –0.55. CR, calretinin; CR*, dye-labelled CR; FD, fluorescein dextrans; MW, molecular weight; Res., residuals.
