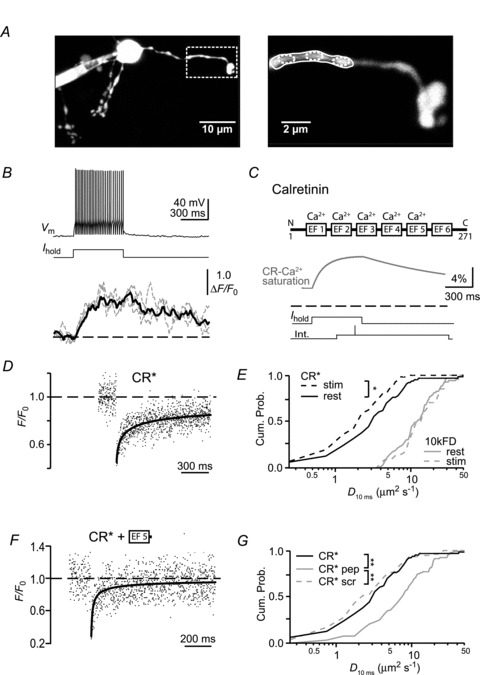
Figure 4. Decreased mobility of CR* during neuronal activity.

A, left: a granule cell loaded with 50 μm OGB-1 and 50 μm Atto-637 via a somatic patch pipette. The box delineates the dendritic region (shown magnified on the right) from which the fluorescence signals in B were recorded. The corresponding regions of interest are denoted by solid and dashed ellipses. B, top: voltage response (Vm) to a somatic current injection (Ihold) of the granule cell shown in A. Bottom: associated relative fluorescence increases of OGB-1 (ΔF/F0) recorded from the dendritic regions indicated by the small dashed (grey traces) and large solid ellipses (black trace) in A. C, scheme of CR (upper panel) with the EF-hands of which five bind Ca2+ (Schwaller et al. 1997). The N- and C-terminals as well as the numbering of the amino acids are indicated. The lower panel shows a numerical simulation of CR's Ca2+ saturation during the average action potential train in the absence of indicator dye. The dashed line indicates 0% saturation. The resting saturation is 4.7%. The two bottom traces illustrate the experimental approach for FRAP recordings during action potential firing. D, FRAP time course of CR* during repetitive firing (average of six recordings). The continuous line represents a fit of the recovery to the subdiffusion equation. E, cumulative probability graph of D10ms values under control conditions (‘CR* rest’, ‘10 kDa FD rest’; data from Fig. 2C) and during action potential firing (‘CR* stim’; n= 56 recordings from 10 cells; *P < 0.05 and ‘10 kDa FD* stim’; n= 36 recordings from nine cells). F, FRAP time course of CR* in the presence of peptide resembling EF-hand 5 of CR, the putative interaction site. The continuous line represents a fit of the recovery to the subdiffusion equation. Note the accelerated recovery compared to Fig. 2B. G, cumulative probability histograms of D10ms values under control conditions (CR*; as in 2C) or in the presence of peptide representing EF-hand 5 of CR (‘pep’; n= 92 recordings from 17 cells) or a scrambled peptide (‘scr’; n= 76/7). **P < 0.001. CR, calretinin; CR*, dye-labelled CR; FD, fluorescein dextrans.
