
Figure 6. Local GABA application-induced currents propagate to electrically coupled astrocytes.
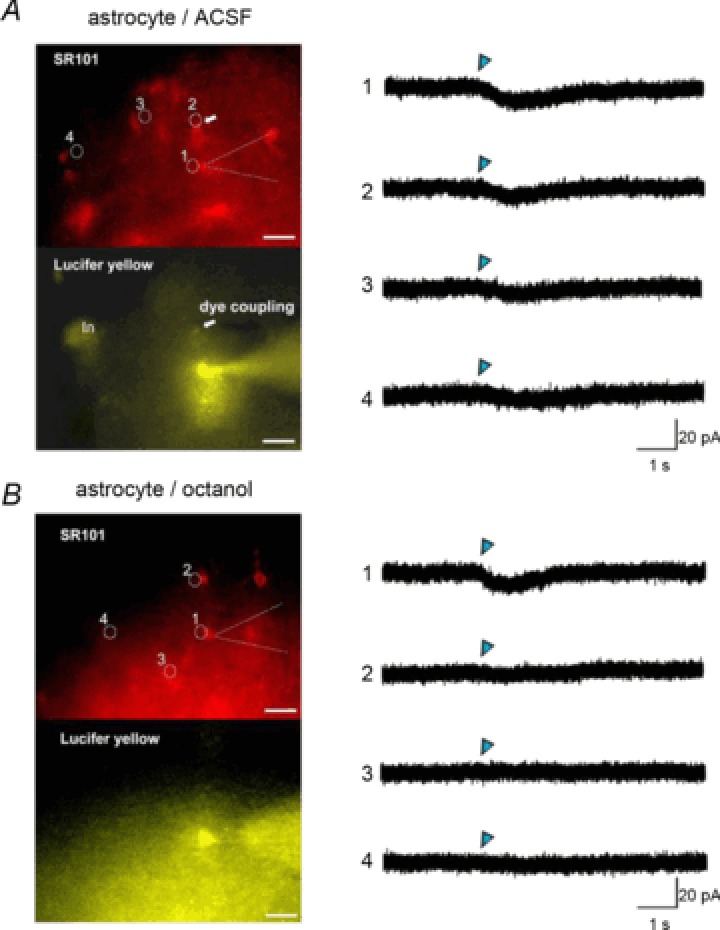
A, astrocytic responses to local GABA photolysis in the absence of gap junction inhibitors. The left upper panel is a SR101 fluorescence image. Numbered circles here and in (B) indicate uncaging spots, which correspond to the traces of uncaged GABA-induced currents in the right panel. Blue triangles indicate the time-points of a 0.9 ns uncaging flush. The patch pipette is indicated by a dashed line. The arrow indicates a dye-coupled astrocyte identified by Lucifer yellow fluorescence (left bottom panel) delivered through a patch pipette. (In) indicates an interneuron labelled by green fluorescent protein. Uncaged GABA-induced currents were recorded by photolysis, focusing on the edge of the patch clamped cell soma (1) or the edge of the dye-coupled cell soma (2). Smaller inward currents were recorded by photolysis on the distant cell somas without dye coupling (3, 4). B, these panels are the same as in (A), but in a slice preincubated with octanol (1 mm). Dye coupling was not observed. The GABA-responsive region was restricted to the vicinity of the recorded astrocyte. Scale bars: 20 μm. SR101, sulforhodamine 101.