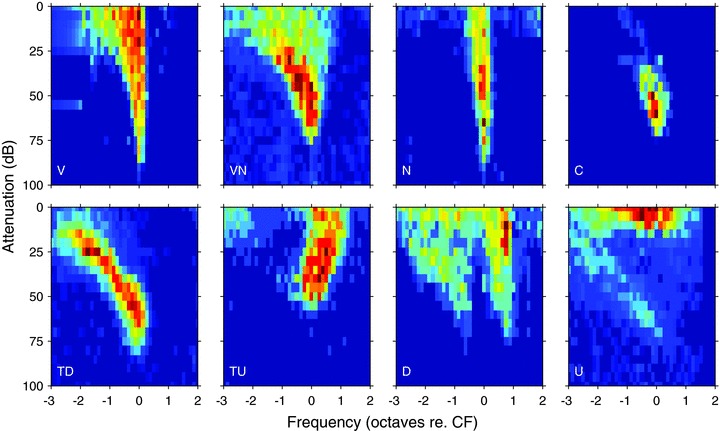
Figure 1. Exemplars of the subjective frequency response area classes in the IC on an octave frequency scale relative to CF.

Each response area was normalised by dividing by the maximum firing rate within the area. The CFs of the units were 14.8, 1.2, 8.0, 0.69, 1.5, 0.55, 5.0 and 0.25 kHz reading from top left to bottom right.
