
Figure 2. Subjective classes of response area plotted as a function of response area type (rows) and CF in octave bands (columns).
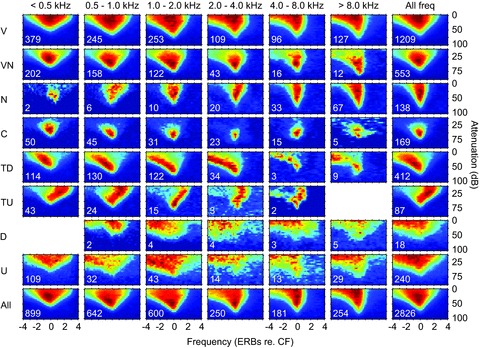
See text for details of the normalisation process. Each plot is the mean of all frequency response areas of that type in that frequency range. The number of neurons included is shown at the bottom left corner of each plot. The final row shows the average of all units irrespective of response area type including D and unclassified. The final column shows the mean of the response type irrespective of CF.