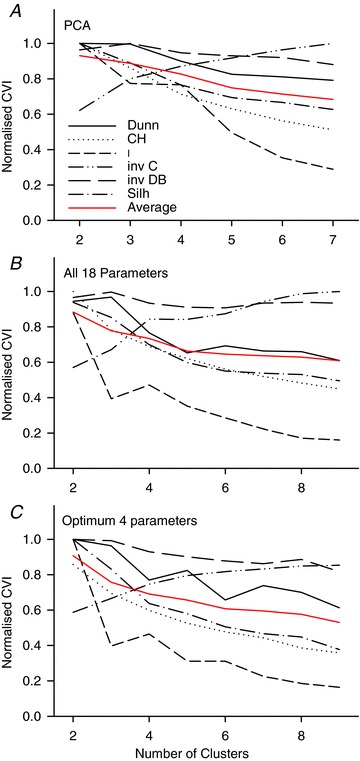
Figure 5. Cluster validity indices (CVIs) as a function of the number of clusters.

The various indices indicate the quality of the clustering. For data falling naturally into a specific number of separable clusters the indices would give an index with a maximum for that number of clusters. Values are normalised to the maximum in the range. A, CVIs for the PCA-based cluster analysis shown in Figs 3 and 4. B, CVIs for clusters based upon all 18 parameters shown in Fig. 7. C, CVIs for clusters based upon the optimum set of parameters for each number of clusters shown in Fig. 8. B and C are normalised to the same maximum, so are directly comparable. Dunn, Dunn index (Dunn, 1973); CH, Caliński–Harabasz index (Caliński & Harabasz, 1974); I, I index (Maulik & Bandyopadhyay, 2002); inv C, inverted C index (Hubert & Levin, 1976); inv DB, inverted Davies–Bouldin index (Davies & Bouldin, 1979); Silh: silhouette (Rousseeuw, 1987); red curve, mean of CVIs after normalisation.
