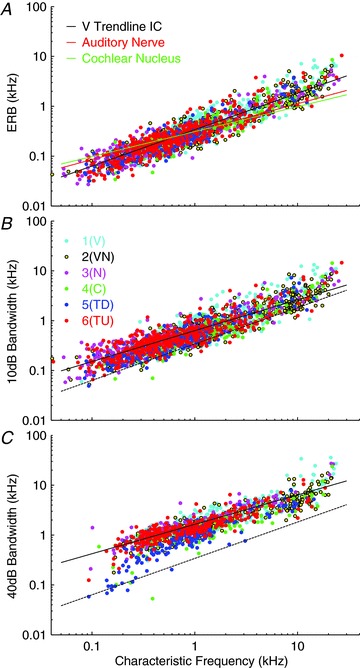
Figure 11. Equivalent rectangular bandwidth (ERB) (A), and bandwidth at 10 dB (B) and 40 dB (C) above threshold as a function of characteristic frequency.

A, lines show ERB estimates from auditory nerve and cochlear nucleus from Evans et al. (1992; red line) and Sayles & Winter (2010; green line) and a trend line fitted to the V-type data for easy comparison (black line). B, the continuous line shows the trend line fitted to the V-type data; the dotted line shows the trend line from the ERB data repeated from panel A. C, continuous line shows the trend line fitted to the V-type data; the dotted line shows the trend line from the ERB data repeated from panel A. Unit classes derived from the clustering based on all 18 parameters with 6 clusters (cf. Fig. 7) are indicated in the key: cyan, 1(V); yellow, 2(VN); magenta, 3(N); green, 4(N); blue, 5(TD); red, 6(TU).
