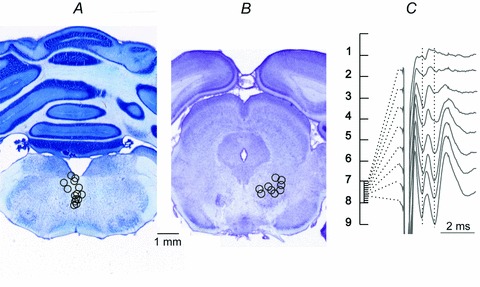
Figure 1. Stimulation sites in and around the MLF and the RN.

A and B, reconstructions of the locations of the stimulating electrodes in and around the MLF and the RN, indicated on representative sections of the medulla and the mesencephalon, respectively. The locations were defined by electrolytic lesions made at the end of the experiments (0.2 mA constant current for 15 s), verified on 100 μm thick sections, cut in the plane of the electrode insertions using a vibratome, mounted on slides, counterstained with cresyl violet and scanned. Stimulation sites are indicated by circles corresponding to the centres of the lesions. The diameters of these circles reflect the areas of approximate spread of current from these sites, within 0.2–0.5 mm for stimuli of 20–50 μA (see Fig. 11 in Gustafsson & Jankowska, 1976). C, indirect volleys (with the onset indicated by the first vertical dotted line) and EMG potentials (indicated by the second dotted line) evoked by 60 μA single stimuli applied along one of the most medial electrode tracks in the RN. Averages of 20 potentials recorded every 100 μm at depths 7.0–7.7 mm from the surface of the skull. Note that the maximal EMG potentials and indirect volleys were evoked from the same electrode sites within RN.
