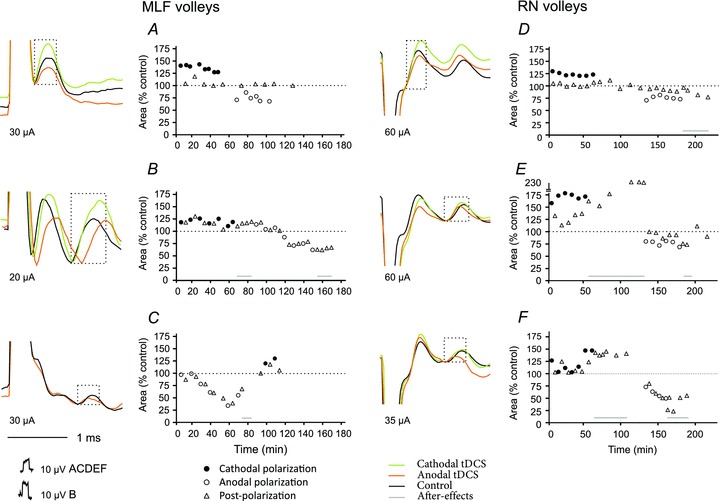
Figure 3. Effects of tDCS on descending volleys evoked from the MLF and the RN.

Examples of direct (A and D) and indirect (B, C, E and F) volleys recorded at C1–C2 spinal levels following MLF or RN stimulation, as indicated. Averages of 20 records during maximal effects of tDCS. Plots show changes in the areas of the volleys in multiples or fractions of areas of control volleys (ordinate indicated by horizontal dotted lines) in successive tests (abscissa) in six experiments. The areas were measured within the indicated time windows (boxes), during tDCS and during periods following tDCS as indicated. Note facilitation occurring during cathodal polarization and depression during anodal polarization. Note also that both facilitation and depression of indirect volleys often outlasted periods of tDCS application. Statistically significant differences were found between descending volleys evoked during cathodal or anodal polarization and control data in all tests illustrated in A–F, except for effects of anodal tDCS on direct volleys from RN and cathodal tDCS on direct volleys from MLF (see Table 1).
