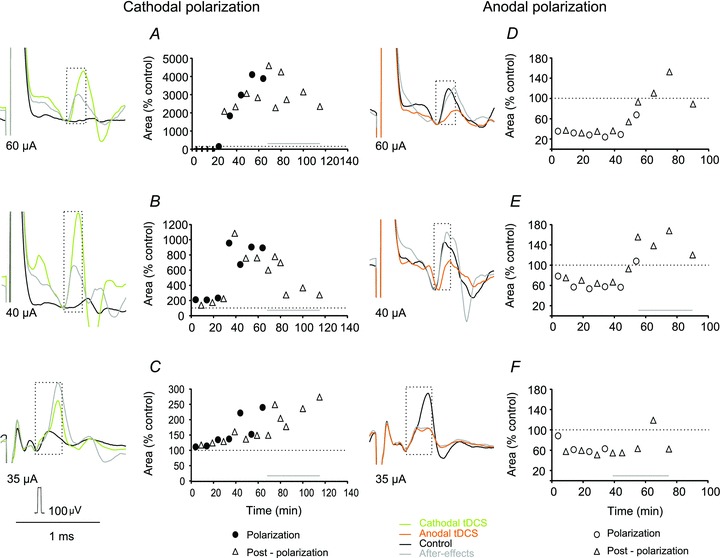
Figure 6. Opposite effects of cathodal and anodal tDCS on compound EMG potentials evoked from RN and the timing of these effects.

A–F, examples of RN-evoked muscle EMG responses recorded from neck muscles before, during and after tDCS, and changes in the areas of these potentials. Changes in areas within the indicated time windows (boxed; ordinate) are plotted for 5 min periods during the total of about 2 h (abscissa). They are expressed as a percentage of the areas of control responses taken as 100%, indicated by the horizontal dotted lines, except for A where the area of EMG potentials appearing during the third polarization period was used for control, as no measurable EMG responses were seen before this period. Horizontal lines above abscissa indicate periods during which facilitatory effects of tDCS outlasted periods of tDCS application. Statistically significant differences were found between EMG responses evoked during cathodal or anodal polarization and control data in all tests illustrated in A–F (see Table 1).
