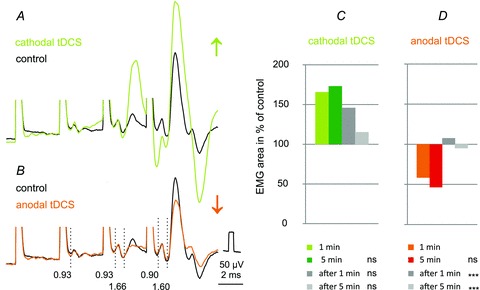
Figure 7. Earliest effects of anodal and cathodal tDCS on MLF-evoked compound EMG potentials.

A and B, averaged records (n= 20) from the surface of the spinal cord in the C1 segment of responses evoked by 25 μA stimuli applied in the MLF. The facilitation was evoked during the first minute of cathodal tDCS and depression during the first minute of anodal tDCS. Vertical dotted lines indicate latencies of the indirect volleys (0.93 ms) and of the most likely disynaptically evoked responses from neck motoneurons (1.6 ms). It will be noted that cathodal tDCS not only enhanced EMG responses following the 4th stimulus but also advanced activation of the muscle (by the third rather than the fourth stimulus). C and D, mean areas of the early parts of EMG potentials (n= 14) recorded from neck muscles or from the surface of the spinal cord during the first and fifth minutes of application of tDCS and during the first and fifth minutes after the end of tDCS. The areas are expressed as a percentage of areas of control EMG potentials. Note in C that substantial increases had occurred already during the first minute of polarization and were not much stronger after 5 min. Note also that the facilitation outlasted the first 5 min period of cathodal tDCS by 1 min but to a much smaller extent by 5 min. However, no statistically significant differences were found between the mean areas of potentials recorded during the first minute of tDCS and later on (Kruskal–Wallis one-way ANOVA on ranks, n= 20, H= 7.1, d.f. = 3, P= 0.070). In D both after-effects of anodal tDCS were statistically significantly smaller than those during the first minute (one-way ANOVA, n= 14, F(3,44)= 10.626, P < 0.001). ***Significant differences with respect to records obtained during the first minute (P < 0.05, post hoc test, Holm–Sidak method); ns, not significant.
