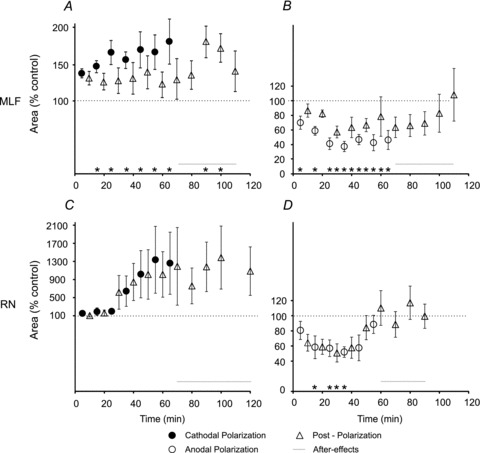
Figure 8. Time course of effects of tDCS on EMG responses.

A and B, areas of EMG potentials (ordinate) evoked from MLF during or after 5 min periods of cathodal (n= 12) and anodal (n= 11) tDCS, respectively, for the total of about 2 h (abscissa). In most experiments effects of cathodal and anodal tDCS were examined subsequently but the order of polarization was reversed in every second experiment. The areas are expressed as multiples or fractions of the areas of control responses. C and D as in A and B except for the EMG potentials (C: n= 5; D: n= 5) evoked from RN for all of which cathodal tDCS was applied before anodal tDCS. Horizontal lines above abscissa indicate periods of outlasting effects of tDCS. *Statistically significant differences between areas of EMG responses evoked during, or after tDCS and of control responses (Holm–Sidak or Dunn's method post hoc analysis, P < 0.05). For further details see Table 2.
