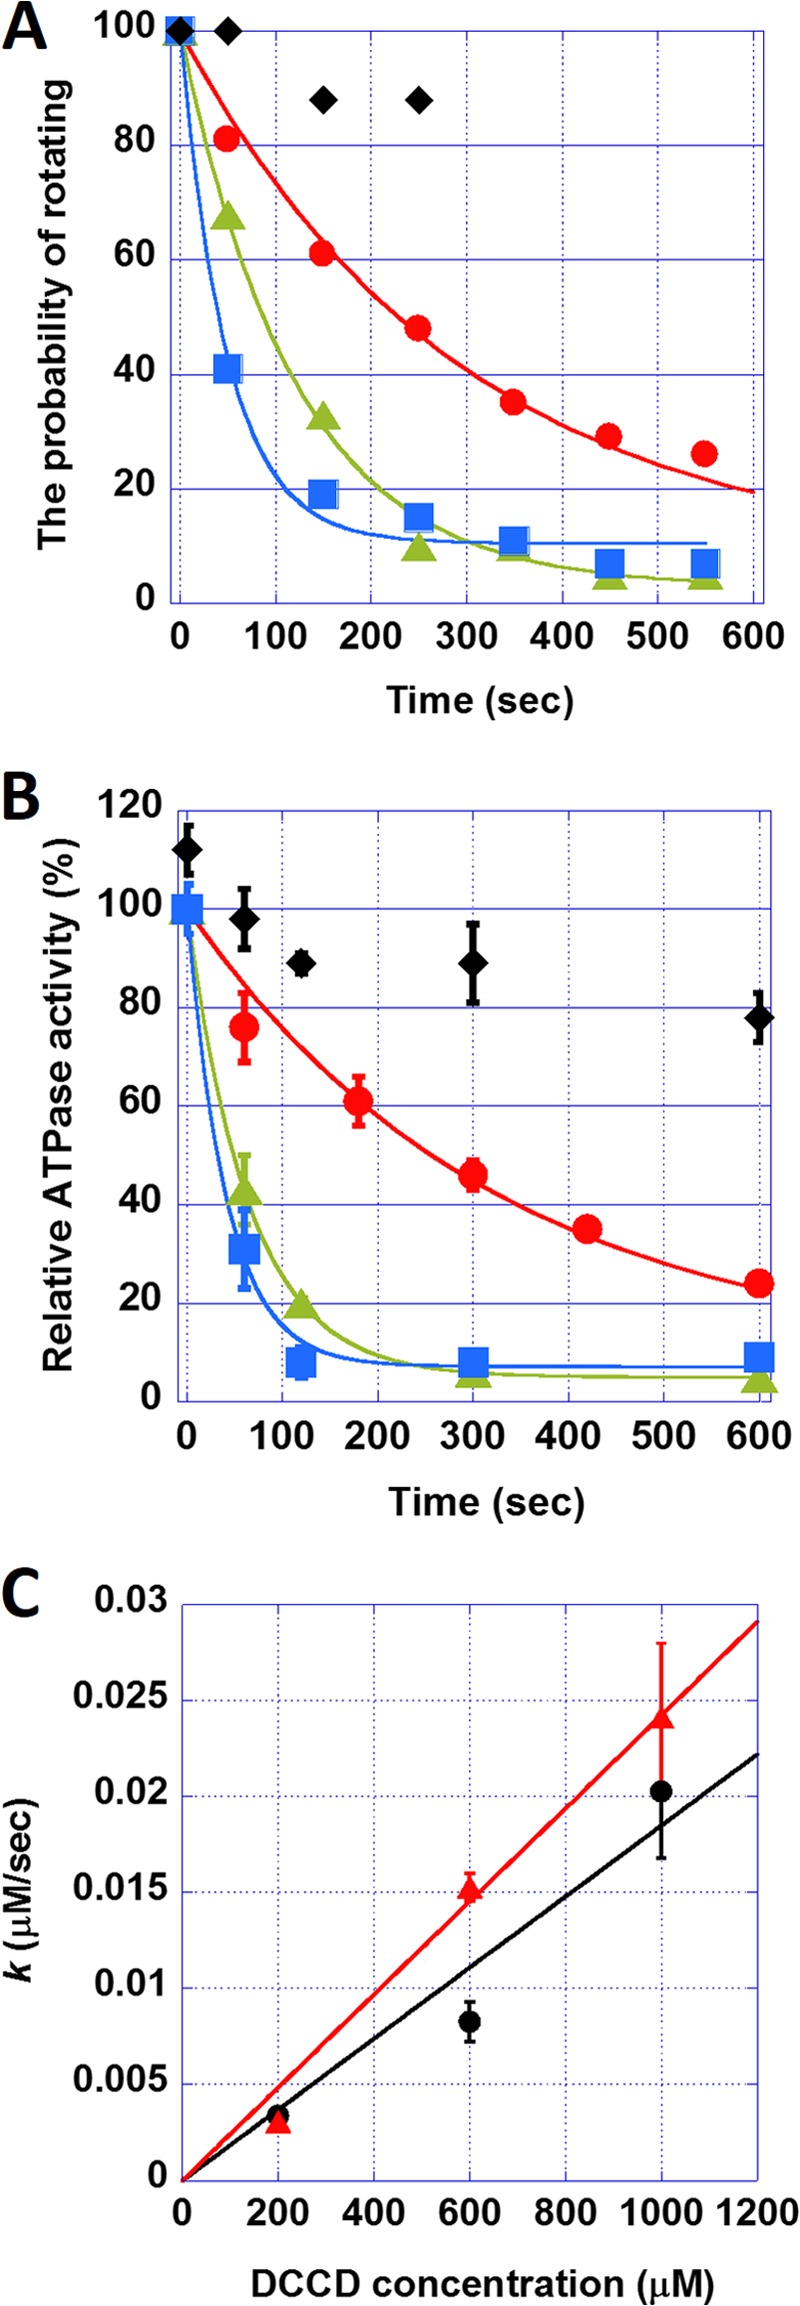
FIGURE 2.

The kinetics of the DCCD inhibition of F0F1. A, the time course of the probability of rotating in the absence (♦) or presence of DCCD at 200 μm (●), 600 μm (▴), and 1 mm (■). Each plot was fitted with y = 100 − a)e−kt. B, the time course of bulk ATPase activities in the presence of DCCD at 200 μm (●), 600 μm (▴), and 1 mm (■). Diamonds (♦) represent ATPase activities in the presence of 0.2% (w/v) LDAO and 1 mm DCCD. Error bars represent the S.E. C, the relationship between the rate constant of DCCD inhibition k and DCCD concentration. The plot was fitted with y = m × x. The slope, m, was 1.9 × 10⁻⁵ and 2.4 × 10⁻⁵ s−1 according to the probability of rotating (black) and bulk ATPase activity (red) assays, respectively. Error bars represent the S.E.
