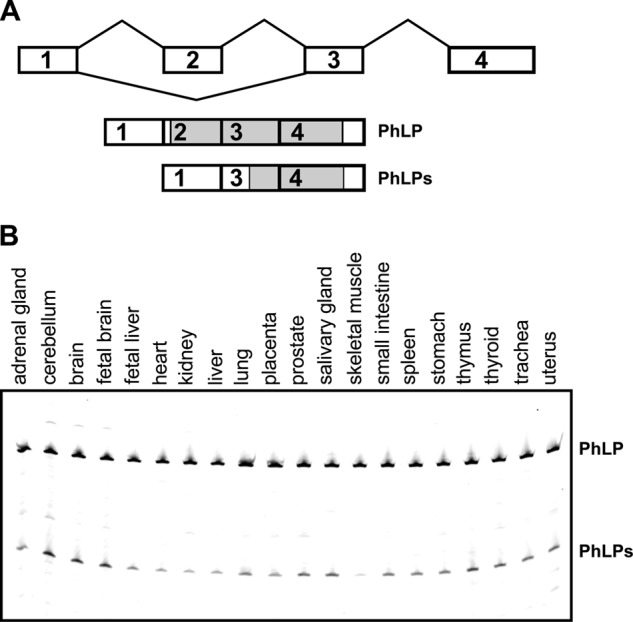
FIGURE 1.

PhLP exon 2 splicing and isoform expression. A, diagram of the PhLP gene structure, showing the splicing pattern of exon 2 and the mRNA isoforms generated as a result of exon 2 alternative splicing. The open reading frame of each mRNA is indicated in gray. B, the truncated PhLPs transcript is expressed in multiple tissues. Shown is RT-PCR analysis of PhLP exon 2 splicing in 20 human tissues. Transcripts skipping exon 2 (PhLPs) were present in all examined tissues. Brain samples express the highest levels of the PhLPs variant.
