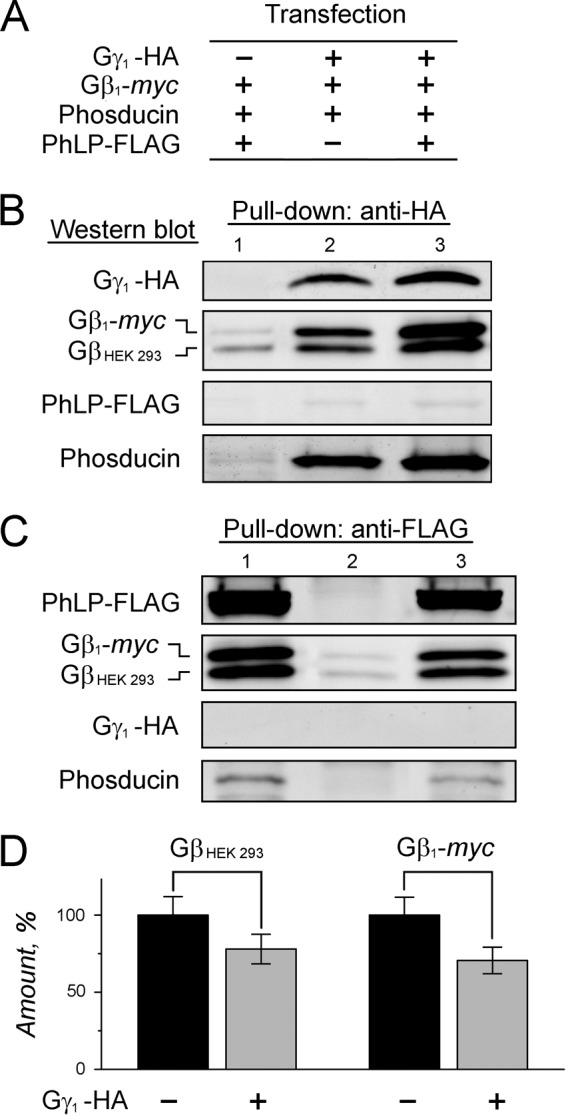
FIGURE 6.

Analysis of the interaction of PhLP with Gβ and Gβγ subunits in cell culture. A, HEK 293 cells were co-transfected with the plasmids encoding the indicated epitope-tagged proteins and analyzed by pull-down with anti-HA or anti-FLAG-agarose after 48 h. B, representative blots showing captured Gγ1-HA and its co-precipitated endogenous GβHEK 293, Gβ1-myc, PhLP-FLAG, and phosducin. C, representative blots showing captured PhLP-FLAG and its co-precipitated GβHEK 293, Gβ1-myc, Gγ1-HA, and phosducin. D, the Gβ1-myc and GβHEK 293 protein bands in C were quantified, and their values were normalized to that of PhLP-FLAG and expressed as a percentage fraction in lane 3 compared with lane 1; GβHEK 293 and Gβ1-myc were reduced by 22 ± 10% (p = 0.094) and 29 ± 9% (p = 0.023). Error bars, S.E. with n = 5. Paired t test was applied.
