
FIGURE 3.
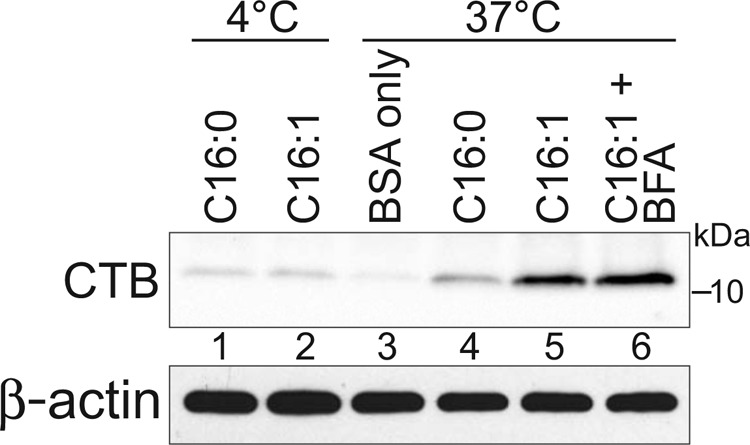
Biochemical quantitation of C16:0/C16:1-GM1 transcytosis. Apical surfaces of MDCK monolayers were treated as indicated with C16:0-GM1 or C16:1-GM1 (no Alexa label, described under “Experimental Procedures”). CTB was immunoprecipitated from cell lysates, separated by SDS-PAGE, and immunoblotted using anti-CTB pAb (top panel). Pre-IP lysates were immunoblotted for β-actin as cell density control (bottom panel). Quantitation of CTB bands showed a 3.7- and 2.8-fold increase in lane 5 as compared with lane 4 in two independent experiments. The CTB band in lane 6 was 38 and 44% greater than lane 5 in two independent experiments. For these measurements, the relevant 4 °C CTB band (lanes 1 and 2) was considered as assay background and subtracted from the CTB bands in lanes 4–6 prior to comparison.