
FIGURE 1.
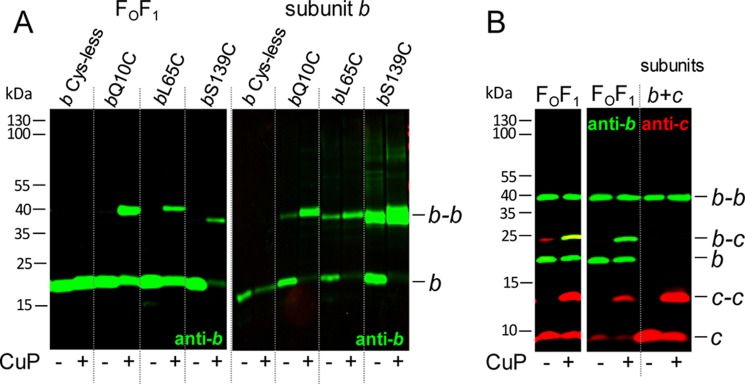
Comparison of cross-linked subunit b or subunits b and c in membranes of cells expressing the atp operon (FOF1) and cells exclusively expressing atpF (subunit b) or atpEF (subunits b and c). A, cross-linking of subunit b. FOF1, DK8 transformed with pBWU13 derivatives (b Cys-less, pSTK3; bQ10C, pBH16; bL65C, pSTK8; bS139C, pBH17) were grown in minimal medium with 0.5% (v/v) glycerol and harvested at OD = 0.8–1.0. subunit b, cells of E. coli HB1(DE3) transformed with pET-22b derivatives (bQ10C, pET22-atpF1; bL65C, pET22-atpF3; bS139C, pET22-atpF2) were grown in LB medium with ampicillin to OD = 0.6 prior to induction of atpF gene expression with 1 mm IPTG for 1 h. Membranes (20 μg of protein/lane) containing cysteine-substituted subunit b were separated after cross-linking with CuP at pH 8.2 by non-reducing SDS-PAGE and analyzed by immunoblotting. B, cross-linking of subunits b and c. FOF1, DK8 transformed with pHB3 (bN2C/cV74C); subunits b + c, cells of HB1(DE3) transformed with pET22-atpEF1 (bN2C/cV74C) were grown and analyzed as described in A. Using the Odyssey system, the intensities of the fluorescence detected in the individually immunolabeled bands are adjusted between a minimum and a maximum for each blot membrane scanned and separately for both detection channels. Due to the extremely high intensity of the red-labeled c and c-c bands of the membranes containing only subunits b and c (right), it was not possible to verify the presence of subunits b and c in the b-c cross-link band of FOF1-containing membranes. Therefore, the left panel shows FOF1 of the same immunoblot after cropping the right part of the right panel to readjust the intensities of the fluorescence.