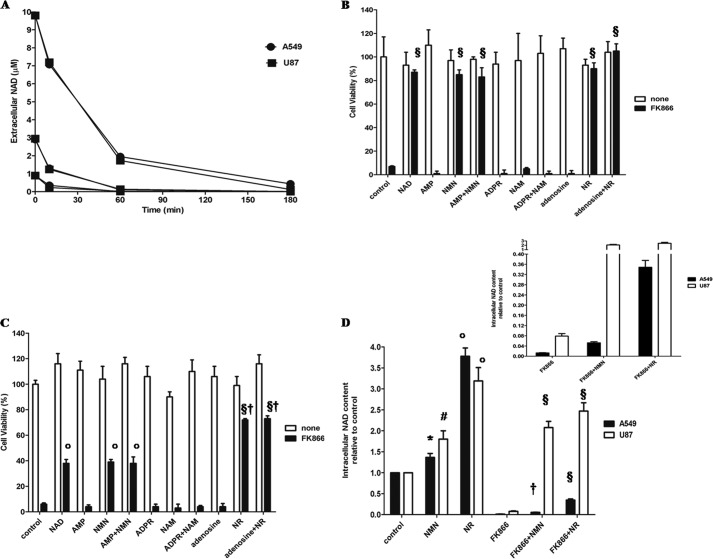
FIGURE 2.
NMN and NR prevent FK866-induced cell death. A, U87 and A549 cells were seeded in 96-well plates (5 × 10³ cells/well) and incubated in complete medium with NAD+ at different concentrations (10, 3, or 1 μm). At the times indicated, medium was collected in triplicate, and PCA was added (0.6 m final concentration). The extracellular NAD+ concentration at different times was evaluated with an enzymatic cycling assay. Results are the mean of three different experiments (S.D. is not shown for sake of clarity). U87 cells (B) or A549 cells (C) were seeded in 96-well plates (5 × 10³ cells/well), and cell viability was evaluated by SBC after a 72-h incubation with or without 30 nm FK866 and with or without a 10 μm concentration of NAD+, AMP, NMN, AMP and NMN, ADPR, NAM, ADPR and NAM, adenosine, NR, or adenosine and NR. Results are expressed as a percentage of cell growth compared with untreated cells. Data are expressed as mean ± S.D. (error bars) (n = 3). §, p < 0.001; °, p < 0.001 compared with FK866-treated cells, in the absence of other supplementations; †, p < 0.001 compared with FK866 + NAD+-treated cells. D, A549 and U87 cells (2 × 10⁵ cells/well in 12-well plates) were treated for 72 h with or without 30 nm FK866 in the presence or absence of 10 μm NMN or NR (added twice a day). Cells were harvested and lysed in 0.6 m PCA, and NAD+ content was measured in neutralized extracts. NAD+ values were normalized on protein content. Data are expressed as the mean ± S.D. (n = 4 and n = 3 for A549 and U87 cells, respectively). #, p < 0.01; °, p < 0.001 compared with the corresponding control cells; §, p < 0.0001; †, p < 0.001 compared with the corresponding FK866-treated cells. Inset, intracellular NAD+ content in A549 and U87 treated with 30 nm FK866 and 10 μm NMN or NR.

