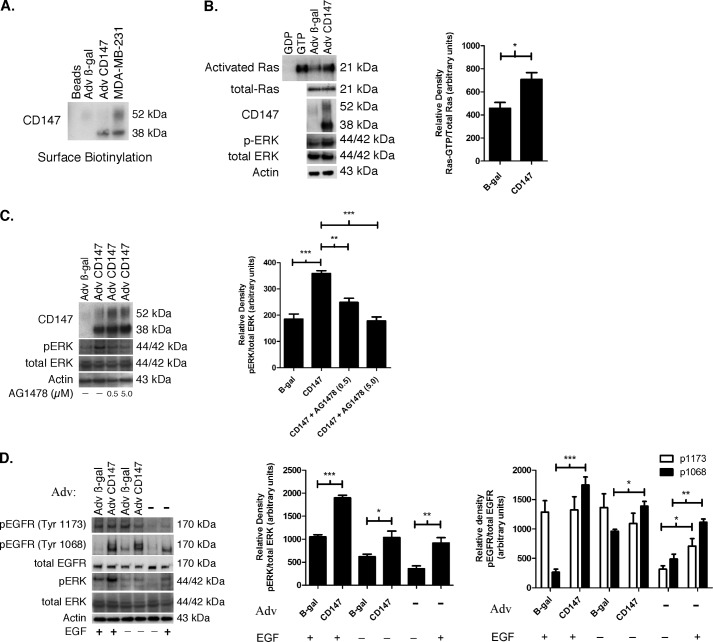
FIGURE 1.
Up-regulation of CD147 induces activation of EGFR-Ras-ERK signaling. A, Western blot depicting surface biotinylation of MCF-10A cells, treated with an MOI of 2 of β-gal or CD147 adenovirus (Adv), compared with untreated MDA-MB-231 cells. An MOI of 2 was used in all subsequent adenovirus experiments. For a negative control, a lane was loaded with eluate from NeutrAvidin resin only (labeled Beads), which was prepared similarly to experimental groups but without cell lysate; n = 3. B, evaluation of Ras activity and ERK phosphorylation in lysates of MCF-10A cells that had been pretreated in culture with β-gal or CD147 adenovirus. Activated Ras was identified by probing with a pan-Ras antibody. Parental MCF-10A whole cell lysates treated directly with GDP and GTP were used as negative and positive controls, respectively. β-Actin was used as a loading control. Left, a representative gel; right, densitometric quantitation of Ras-GTP versus total Ras. Columns are means ± S.E. (error bars); n = 4; *, p < 0.05. C, effect of inhibition of EGFR activity on ERK phosphorylation in MCF-10A cells treated with β-gal or CD147 adenovirus. After treatment with adenovirus for 24 h in full medium, cells were incubated in supplement-free medium for 4 h and subsequently treated with vehicle (DMSO) or 0.5 and 5.0 μm tyrphostin (AG1478) for 12 h. β-Actin was used as a loading control. Left, a representative gel; right, densitometric quantitation of p-ERK versus total ERK. Columns are means ± S.E.; n = 3; **, p < 0.01; ***, p < 0.001. D, EGFR and ERK phosphorylation in MCF-10A cells treated with β-gal or CD147 adenovirus for 24 h in fully supplemented medium, followed by incubation in medium containing supplements with and without EGF (20 ng/ml) for 6 h; EGFR activation was evaluated by probing for phosphorylation of the tyrosine 1173 or 1068 residues. For controls, parental MCF-10A cells were incubated in medium containing supplements with and without EGF (20 ng/ml) for 6 h. β-Actin was used as a loading control. Left, a representative gel; middle, densitometric quantitation of p-ERK versus total ERK; right, densitometric quantitation of p-EGFR versus total EGFR. Columns are means ± S.E.; n = 3; *, p < 0.05; **, p < 0.01; ***, p < 0.001.

