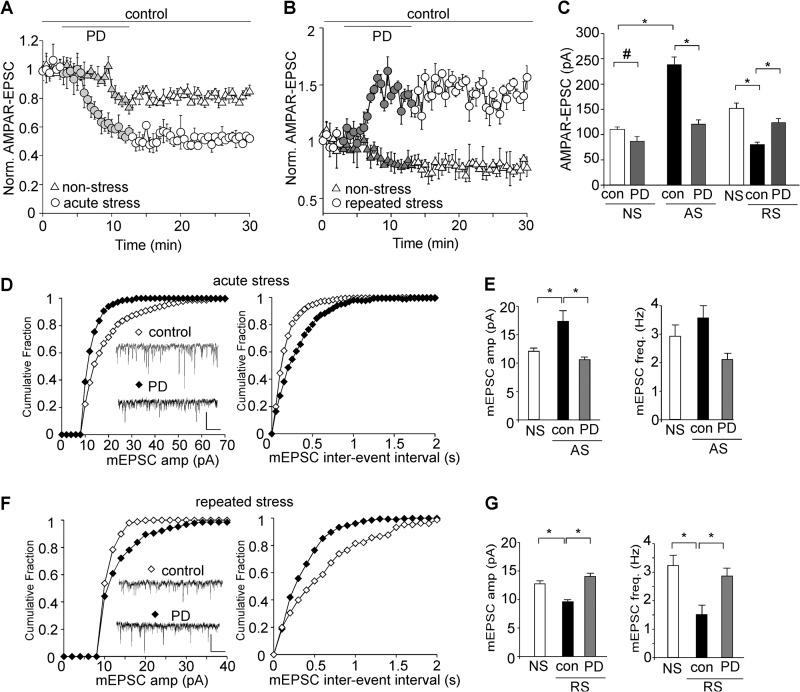
FIGURE 2.
The stress-induced alteration of glutamatergic transmission is restored by D4 activation. A and B, plot of normalized AMPAR-EPSC showing the effect of PD168077 (40 μm) in nonstressed versus animals exposed to acute stress (A) or repeated stress (B). C, Bar graphs (mean ± S.E. (error bars)) showing the amplitude of EPSC in PFC neurons from nonstressed, acutely stressed, or repeatedly stressed animals before and after PD168077 application. #, p < 0.05; *, p < 0.001, ANOVA. D and F, cumulative distribution plot showing the effect of PD168077 (40 μm) on miniature EPSC amplitude and interevent interval in animals exposed to acute stress (D) or repeated stress (F). Inset, representative mEPSC traces. Scale bar, 20 pA, 1 s. E and G, bar graphs (mean ± S.E.) showing the amplitude and frequency of mEPSC in PFC neurons from different groups (NS, AS, RS) before and after PD168077 application. *, p < 0.001, ANOVA.

