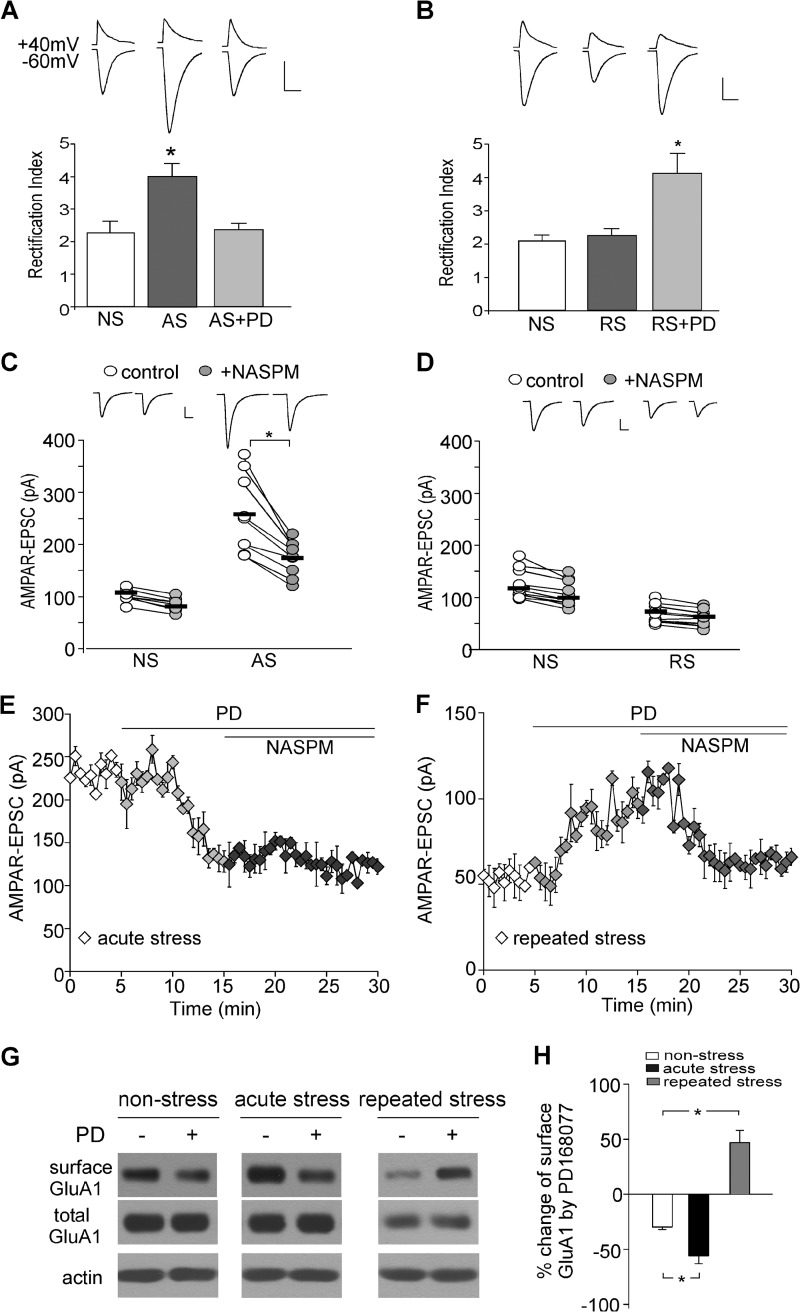
FIGURE 3.
D4 targets GluA2-lacking AMPARs in stressed animals. A and B, bar graphs showing the rectification index of AMPAR-EPSC in PFC neurons from nonstressed, acutely stressed (A), or repeatedly stressed (B) animals before and after PD168077 (40 μm) application. Insets, representative EPSC traces at +40 mV and −60 mV. Scale bar, 50 pA, 20 ms, p < 0.001, ANOVA. C and D, dots plots showing the amplitude of AMPAR-EPSC in PFC neurons from nonstressed, acutely stressed (C) or repeatedly stressed (D) animals before and after NASPM (100 μm) application. Insets, representative EPSC traces. Scale bar, 50 pA, 20 ms. *, p < 0.001, t test. E and F, plot of AMPAR-EPSC showing the effect of PD168077 and subsequent NASPM in animals exposed to acute stress (E) or repeated stress (F). G and H, immunoblots of surface and total GluA1 subunit and quantification of the surface GluA1 in PFC slices from nonstressed, acutely stressed, or repeatedly stressed animals without or with PD168077 treatment. *, p < 0.01, ANOVA. Error bars indicate mean ± S.E.

