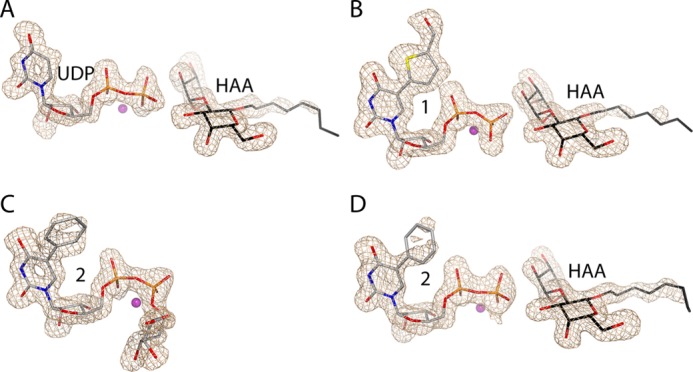
FIGURE 3.

Electron density maps of the UDP-Gal derivatives and HAA in the AAGlyB complex structures. A, chain B of the AAGlyB-UDP-HAA structure. B, chain A of AAGlyB-1-HAA. C, chain A of AAGlyB-2. D, chain B of AAGlyB-2-HAA. All maps are Fo − Fc electron density simulated annealing omit maps (contoured at 3 σ) surrounding the UDP-Gal derivatives and HAA.
