
FIGURE 2.
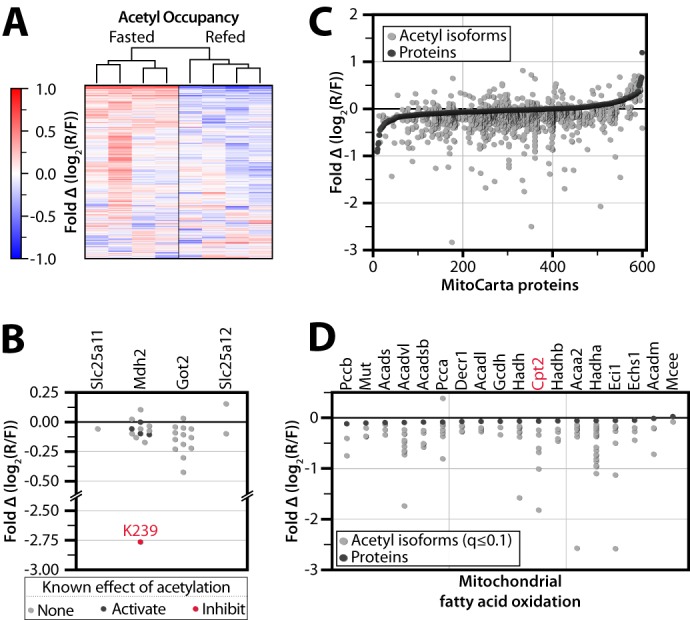
Global analysis of acute protein and acetylation changes during the transition from fasting to refeeding. A, heat map showing unsupervised average linkage hierarchical clustering of four fasted and four refed mice groups them according to nutrient status. Values are colored based on relative acetyl occupancy, normalized to the average of all eight mice, on a log2 scale from less than −1 to greater than 1. R/F, refed/fasted. B, relative acetyl occupancy fold change for proteins in the malate-aspartate shuttle. The acetylation site previously shown to inhibit Mdh2 activity is shown in red, whereas those previously shown to activate Mdh2 are shown in black. Other sites we detected as acetylated but that have no prior functional data are shown in gray. C, changes in acetylation are greater than changes in protein abundance. All quantified MitoCarta proteins are ranked on the x axis by protein abundance fold change, refed/fasted (black dots). Relative acetyl isoform changes are plotted in the same position on the x axis as the corresponding protein measurement (gray dots). D, acetyl and protein abundance changes in mitochondrial fatty acid oxidation. Proteins are marked in black, and significantly changing (q ≤ 0.1) acetyl isoforms are marked in gray.